

1. 서 론
2. 재료 및 방법
2.1 MA 시료 채집 및 EPD 세포 추출
2.2 EPD 속에 대한 현미경 관찰과 세포 계수
2.3 조사해역을 대표하는 EPD 속별 총평균 생물량
2.4 MA Sample Data 기반 및 MA Species Data 기반 분석자료 쌍의 산점도 분석
3. 결과 및 고찰
3.1 MA 시료의 조성과 EPD 세포의 출현
3.2 조사해역을 대표하는 EPD 속별 총평균 생물량
3.3 시료 채집점 36개의 EPD 속별 평균 생물량과 시공간적 분포
3.4 MA Sample Data와 MA Species Data의 비교
3.5 온대 해역에서 나타난 높은 Gambierdiscus 생물량
3.6 EPD 생물량의 시공간적 분포 특성을 감안한 시료 채집 방법
1. 서 론
착생와편모류(Epiphytic Dinoflagellates, 이하 <EPDs>라 함)의 출현 및 정량 분포에 대한 국내 최초 연구는 제주 연안에서 이루어졌다(Kim et al., 2011). 그 이후, 한국 연안해역 EPD에 대한 분포 생태학, 분류학, 생태 생리학 및 새로운 생물 분자 생명 공학 등의 분야에서 40여 편의 연구 논문이 출판되었다(Hwang et al., 2018; Lee et al., 2019; Kim et al., 2021; Lim and Jeong, 2021; Li et al., 2021; Oh et al., 2023; Hyung et al., 2024; Perrois et al., 2024). 화학적으로 새로운 독소를 포함한 새로운 생물 분자가 보고되었고(Hwang et al., 2013; Yang et al., 2017; Hwang et al., 2018; Lee et al., 2019; Lee et al., 2022), 새로운 분자(신규 분자)의 생명 공학적 유용성 등도 EPD 클론 배양체의 대량 배양을 통해 규명되었다(Rho and Yoo, 2022).
EPD의 분포 생태를 조사하기 위해, 일반적으로 제주 연안이나 한반도 연안 정점에서 계절별, 2개월마다 또는 월별로 숙주 생물종인 대형해조류(Macroalgae, 이하 <MA>라 함)의 시료를 채집한다. 따라서, 시공간적으로 서로 다른 시료 채집점에서 다양한 숙주 MA 종들의 시료를 채집하고, 이 시료에 착생한 EPD 세포를 수확하게 된다. 세부적으로는, 특정 숙주 MA 종이라 하더라도, EPD 세포는 MA 식물체 자체의 3차원적 표면의 어느 지점에 부착하여 살아갈 수 있다(Yong et al., 2018; Lee et al., 2020). 스스로 해수 중의 3차원 공간에서 서식하는 MA 식물체 자체의 구조가 또 다시 3차원 표면으로 되어 있어, 여기에 착생하여 살아가는 EPD 세포는, 결국, 공간적으로 이중-3D (3D-3D)인 미세한 환경에서 서식하는 생물종이라 할 수 있다(Tester et al., 2022; Villareal and Morton, 2002).
다차원 공간 분포를 하는 생물종들의 경우, 이들에 대한 관찰 또는 측정 결과에 대한 정량적 데이터를 처리하는 단계가 관련 집단의 시공간적 역학을 규명하는 출발점이다(Opedal et al., 2020; Rahnenführer et al., 2023). 데이터 처리의 초기 단계의 시작점은 불일치하거나 의심스럽거나 예상치 못한 값을 식별해 내어, 변수의 분포를 설명하고, 누락된 값들을 확인하는 등의 일차적인 데이터의 분석이다(Rahnenführer et al., 2023). 다음으로, 평균값을 결정하게 되는데, 예를 들어, 연간, 월간 또는 주별 평균값(Kalloniati et al., 2023), 주요 플랑크톤 그룹의 평균 생물량 추세(Holland et al., 2023), 또는 평균 편차(표준 편차 또는 평균의 표준 오차)(Flynn and Skibinski, 2020)는 장기 온난화 및 인간에 의해 유발된 종 이동 조건에서 생태계 분석 등에 이용할 수 있는 기본적이고 필수적인 분석치들이다.
추계 1회 채집한 6개 정점 MA 시료의 EPD 정량분포에 대한 직전 연구(Kim et al., 2011)를 확장하여, 6개 정점에서 격월로 연중 채집한 520개 MA 시료를 대상으로 수행된 본 EPD 연구를 통해, 제주 연안의 연중 EPD 속별 시공간적 정량 분포의 특성을 파악하려 하였다. 즉, 년 6회 6개 정점에서 채집한 MA 시료를 분석하여, 제주 연안역을 대표하는 연중 EPD 속별 생물량 최대값과 평균값 및 36개 시공간적 시료채집점 각각에서 EPD 속별 생물량의 연중 평균값 등을 제시하여, 제주 해역 EPD의 분포생태학적 특성을 분석하고자 하였다. 또한, 전체 연구를 통해 일관되게 MA 시료를 잠수채집하여, 자료의 상호비교 및 검정이 가능한 EPD 생물량 값을 도출하려 하였으며, 연중 실시된 잠수채집을 기반으로 한 본 EPD 속별 생물량 분석결과를 제주해역을 대표하는 표준적인 생물량 값으로 제시하고자 하였다.
2. 재료 및 방법
2.1 MA 시료 채집 및 EPD 세포 추출
다섯 개 EPD 속의 시공간적 분포를 규명하기 위하여, 제주 연안역의 6개 정점에서 2013년 2월부터 두 달 간격으로 6회 현장조사를 실시하였다(Fig. 1 (Oh et al., 2023의 Fig. 1 and Table 2 참고)). 조사 시기마다 부착 기질인 MA 종 별로 구분하여 해조체를 잠수채집하고, 1개씩 수중에서 플라스틱 시료병에 옮겨 담았다. 현장에서 3%의 중성 포름알데히드 용액에 시료를 고정하여 실험실로 옮긴 후, EPD 세포를 해조체에서 분리해 내기 위해 시료병을 100회 이상 손으로 세게 흔든 다음, 망구 500μm의 Nitex mesh를 통해 이물질을 걸러내었다(Oh et al., 2023).
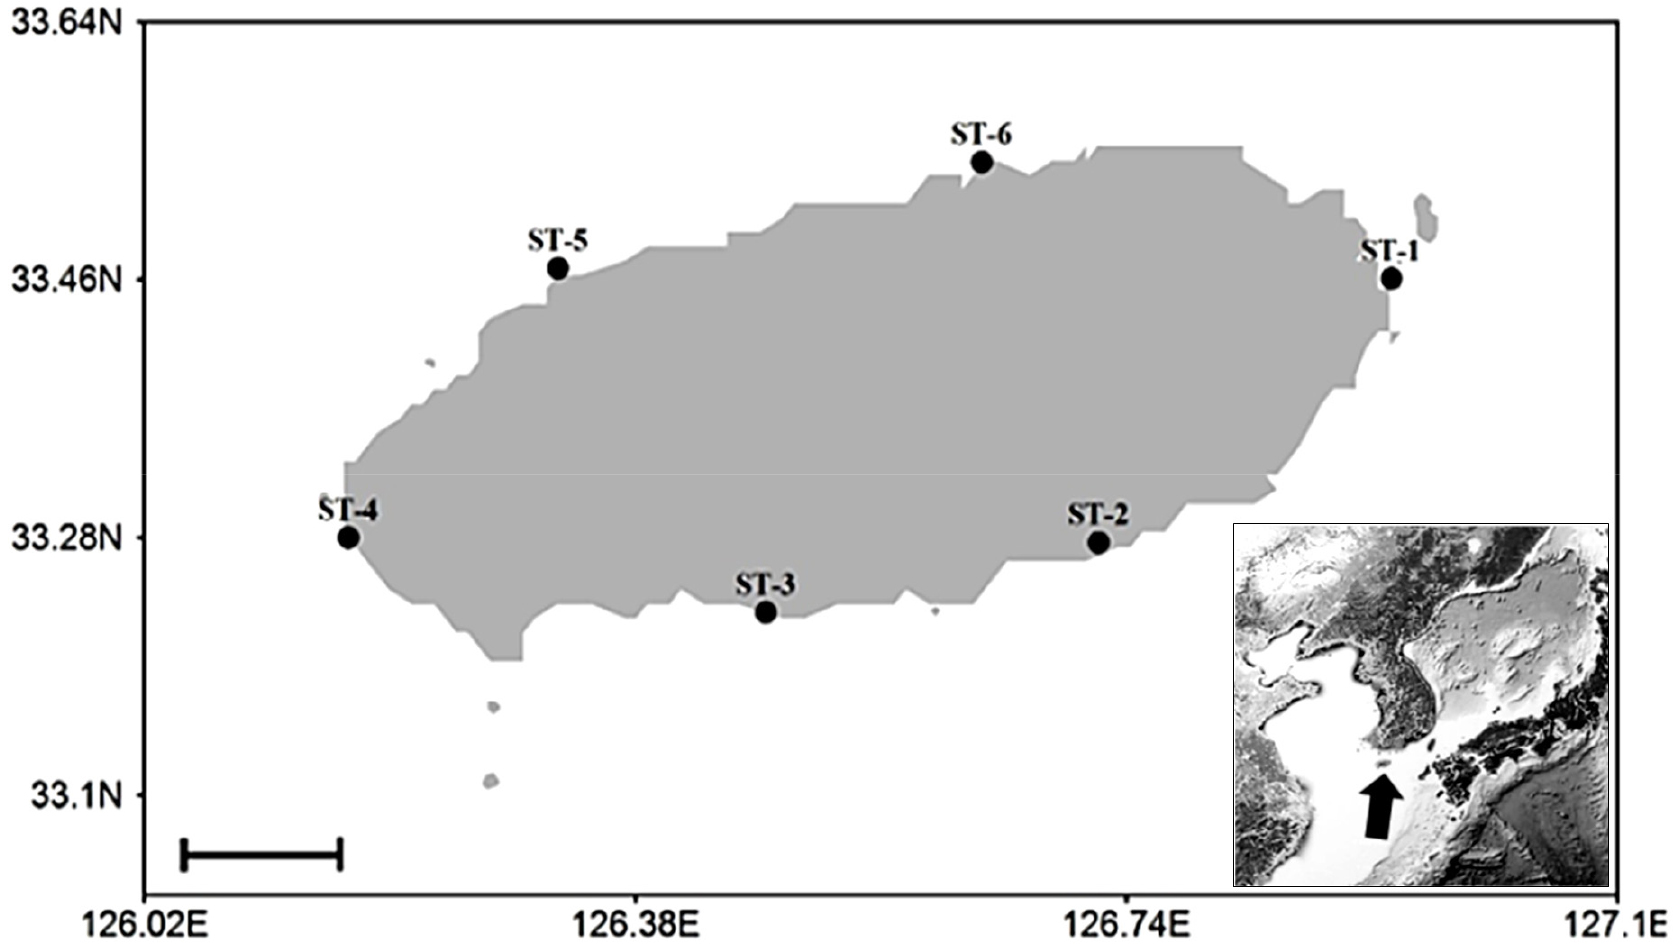
Fig. 1.
Location of Jeju Island (left upper) and the six sampling stations (lower right separate box) around Jeju Island (scale bar = 10 miles) (Modified from Fig.1 in Oh et al. 2023).
2.2 EPD 속에 대한 현미경 관찰과 세포 계수
여과액 안의 EPD 세포를 48시간 동안 중력 침강시킨 다음, 상층액을 따라내고 남은 용액이1/5-1/10 분량이 되도록 농축하였다. 농축 여과액 속의 EPD 세포를 Calcofluor-white (Sigma Aldrich)로 형광 염색하고, Sedgwick-Rafter 계수판에 담아 광학현미경(Zeiss AxioCam HRc5, Carl Zeiss Ltd. Göttingen, Germany) 아래에서 관찰, 계수하였다. 5개의 EPD 속(Amphidinium, Coolia, Gambierdiscus, Ostreopsis, 및 Prorocentrum 속 등) 각각에 대하여 계수하고, 이를 각 EPD 속별로 MA 시료 습중량 1그램 중의 평균 생물량(cells gww-1)으로 환산하였다.
520개 MA 시료 각각에서 결정된 각 EPD 속별 평균 생물량(총 자료 수 2600개)을 시료의 EPD 속별 세포 생물량이라 하였다(이하, <MA Sample Data>라 함). 36개 시료 채집점 각각에서 같은 종에 속하는 MA의 시료가 두 개 이상인 경우에는, 단위 채집점 내의 복수 동일 MA 종 시료에서 결정된 EPD 속별 MA Sample Data 들의 평균을 계산하여, 이를 각 시료 채집점을 대표하는 MA 종 평균의 EPD 세포 생물량 자료(이하, <MA Species Data>라 함; 총 자료 수 1955개)에 포함시켰다.
2.3 조사해역을 대표하는 EPD 속별 총평균 생물량
제주해역에서 관찰된 EPD 속별 정량자료를 기반으로 하여, 제주해역을 대표하는 EPD 속별 총평균 생물량을 결정하기 위하여, 다음 3가지 기준을 적용하였다. 첫 번째 기준의 종평균은 EPD 속별로 520개 및 391개인 MA Sample Data (Fig. 2) 및 MA Species Data (Fig. 3)의 단순 평균이다. 두 번째 기준의 총평균은 520개 시료를 MA 종별 시료군으로 나누어, 81개의 서로 다른 MA 종 시료군에서 각각 구한 81개씩의 MA Sample Data 및 MA Species Data의 EPD 속별 평균 생물량의 평균값이다. 세 번째 기준의 총평균은 36개 시료 채집점 별로 각각 구한 36개씩의 MA Sample Data 및 MA Species Data의 EPD 속별 평균 생물량의 평균값이다.
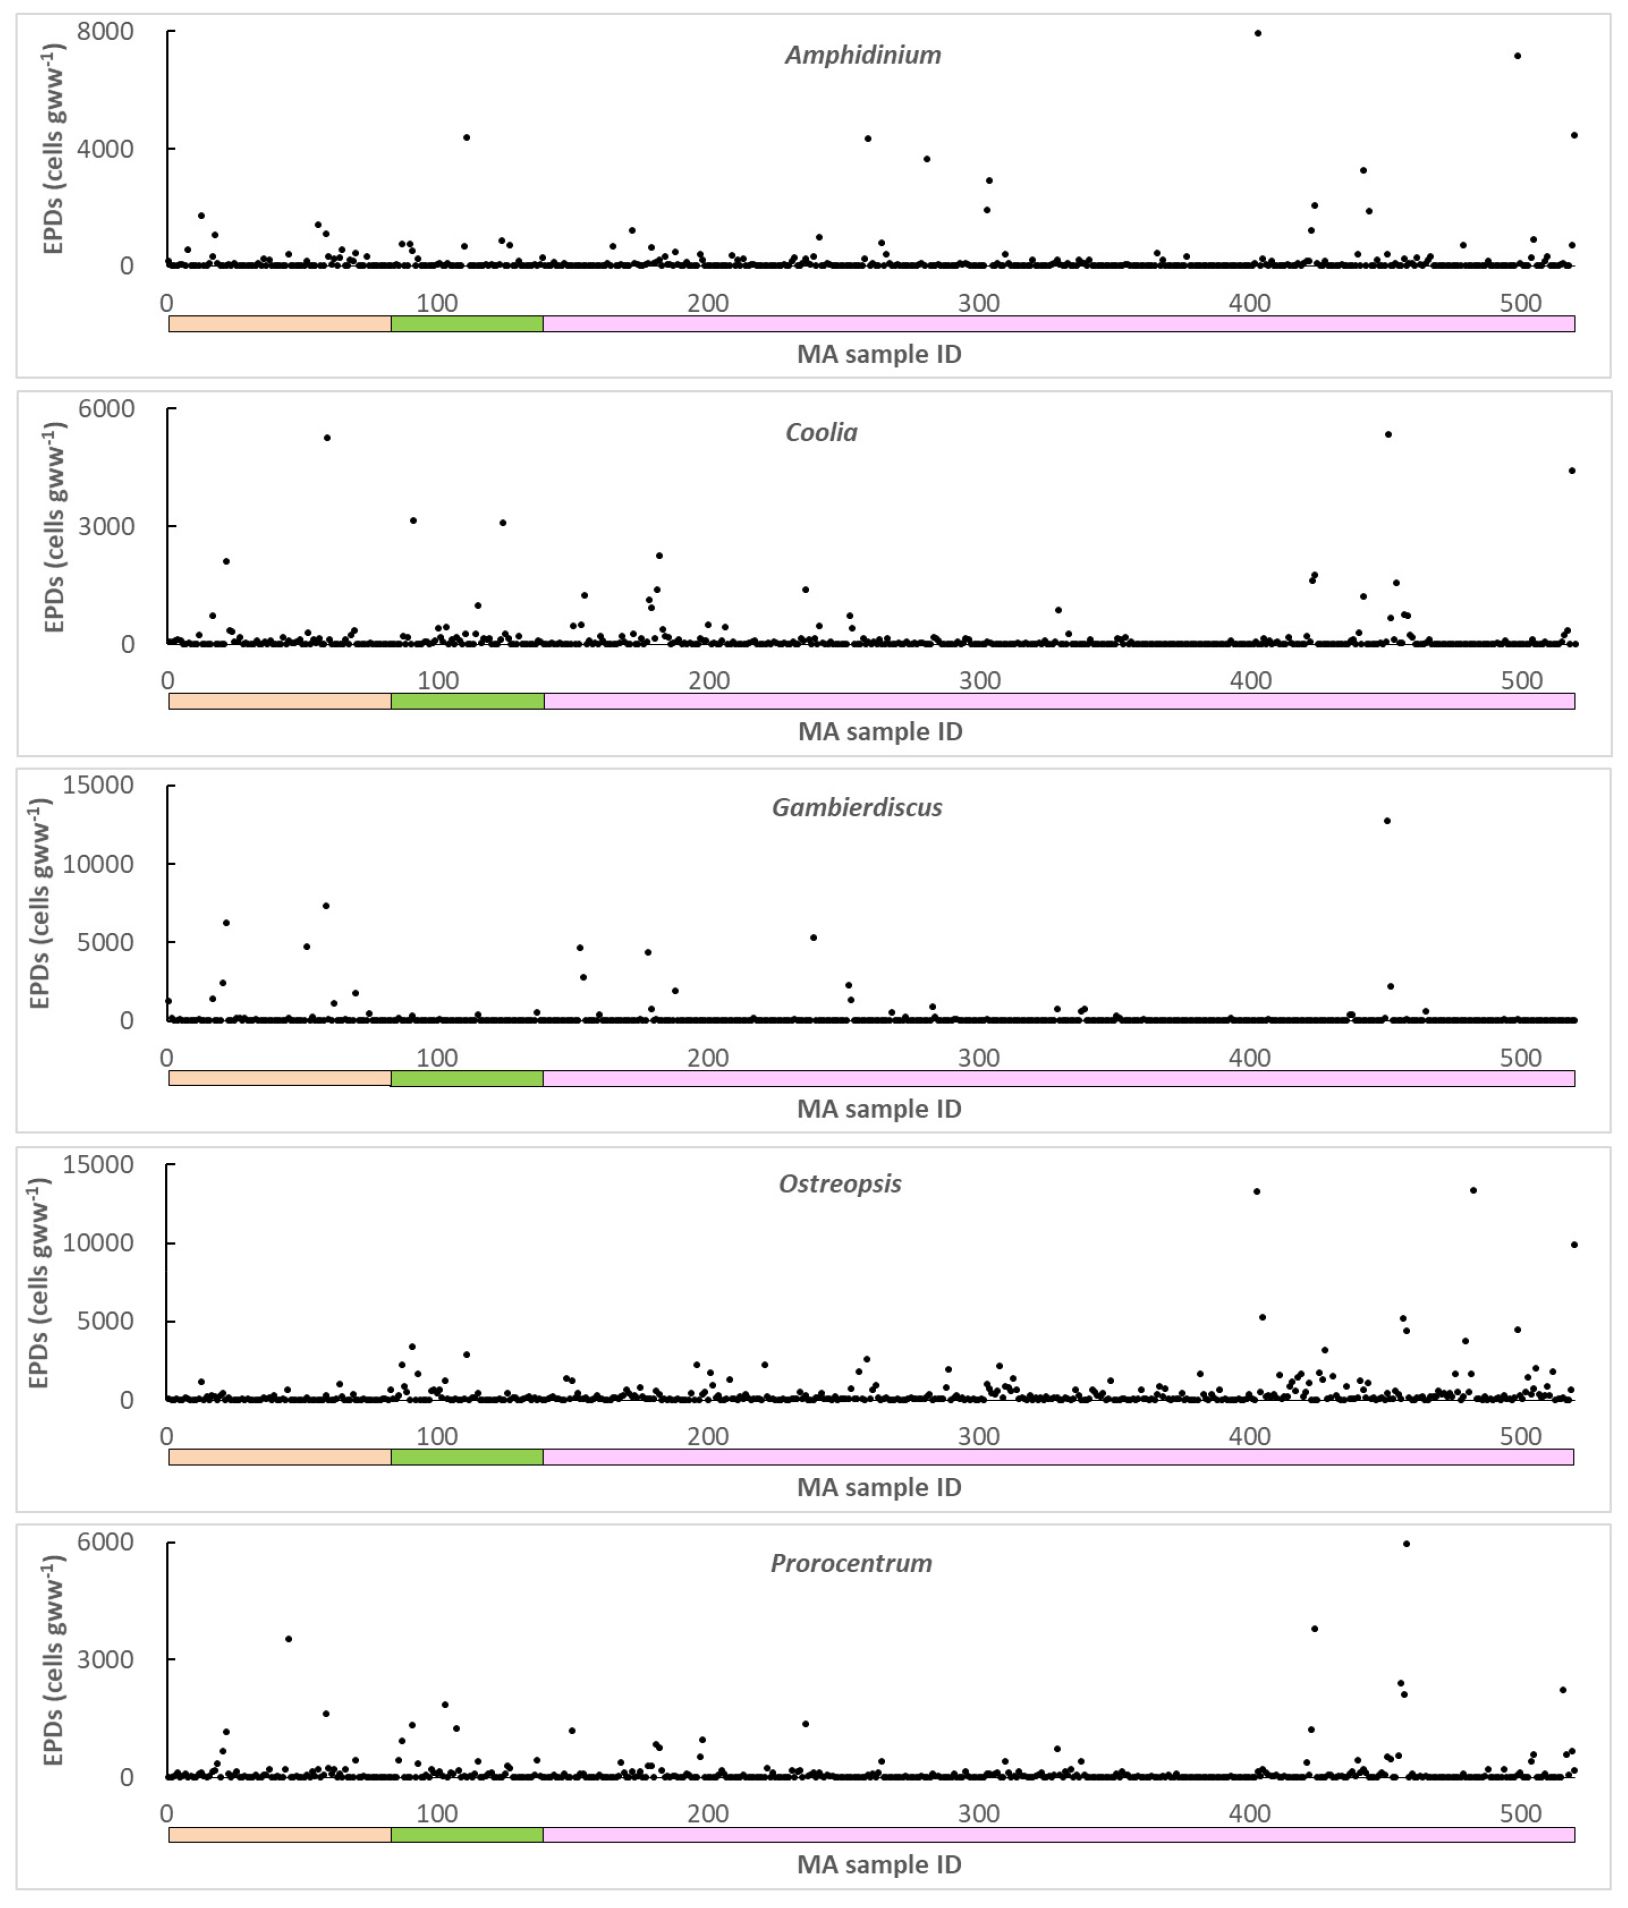
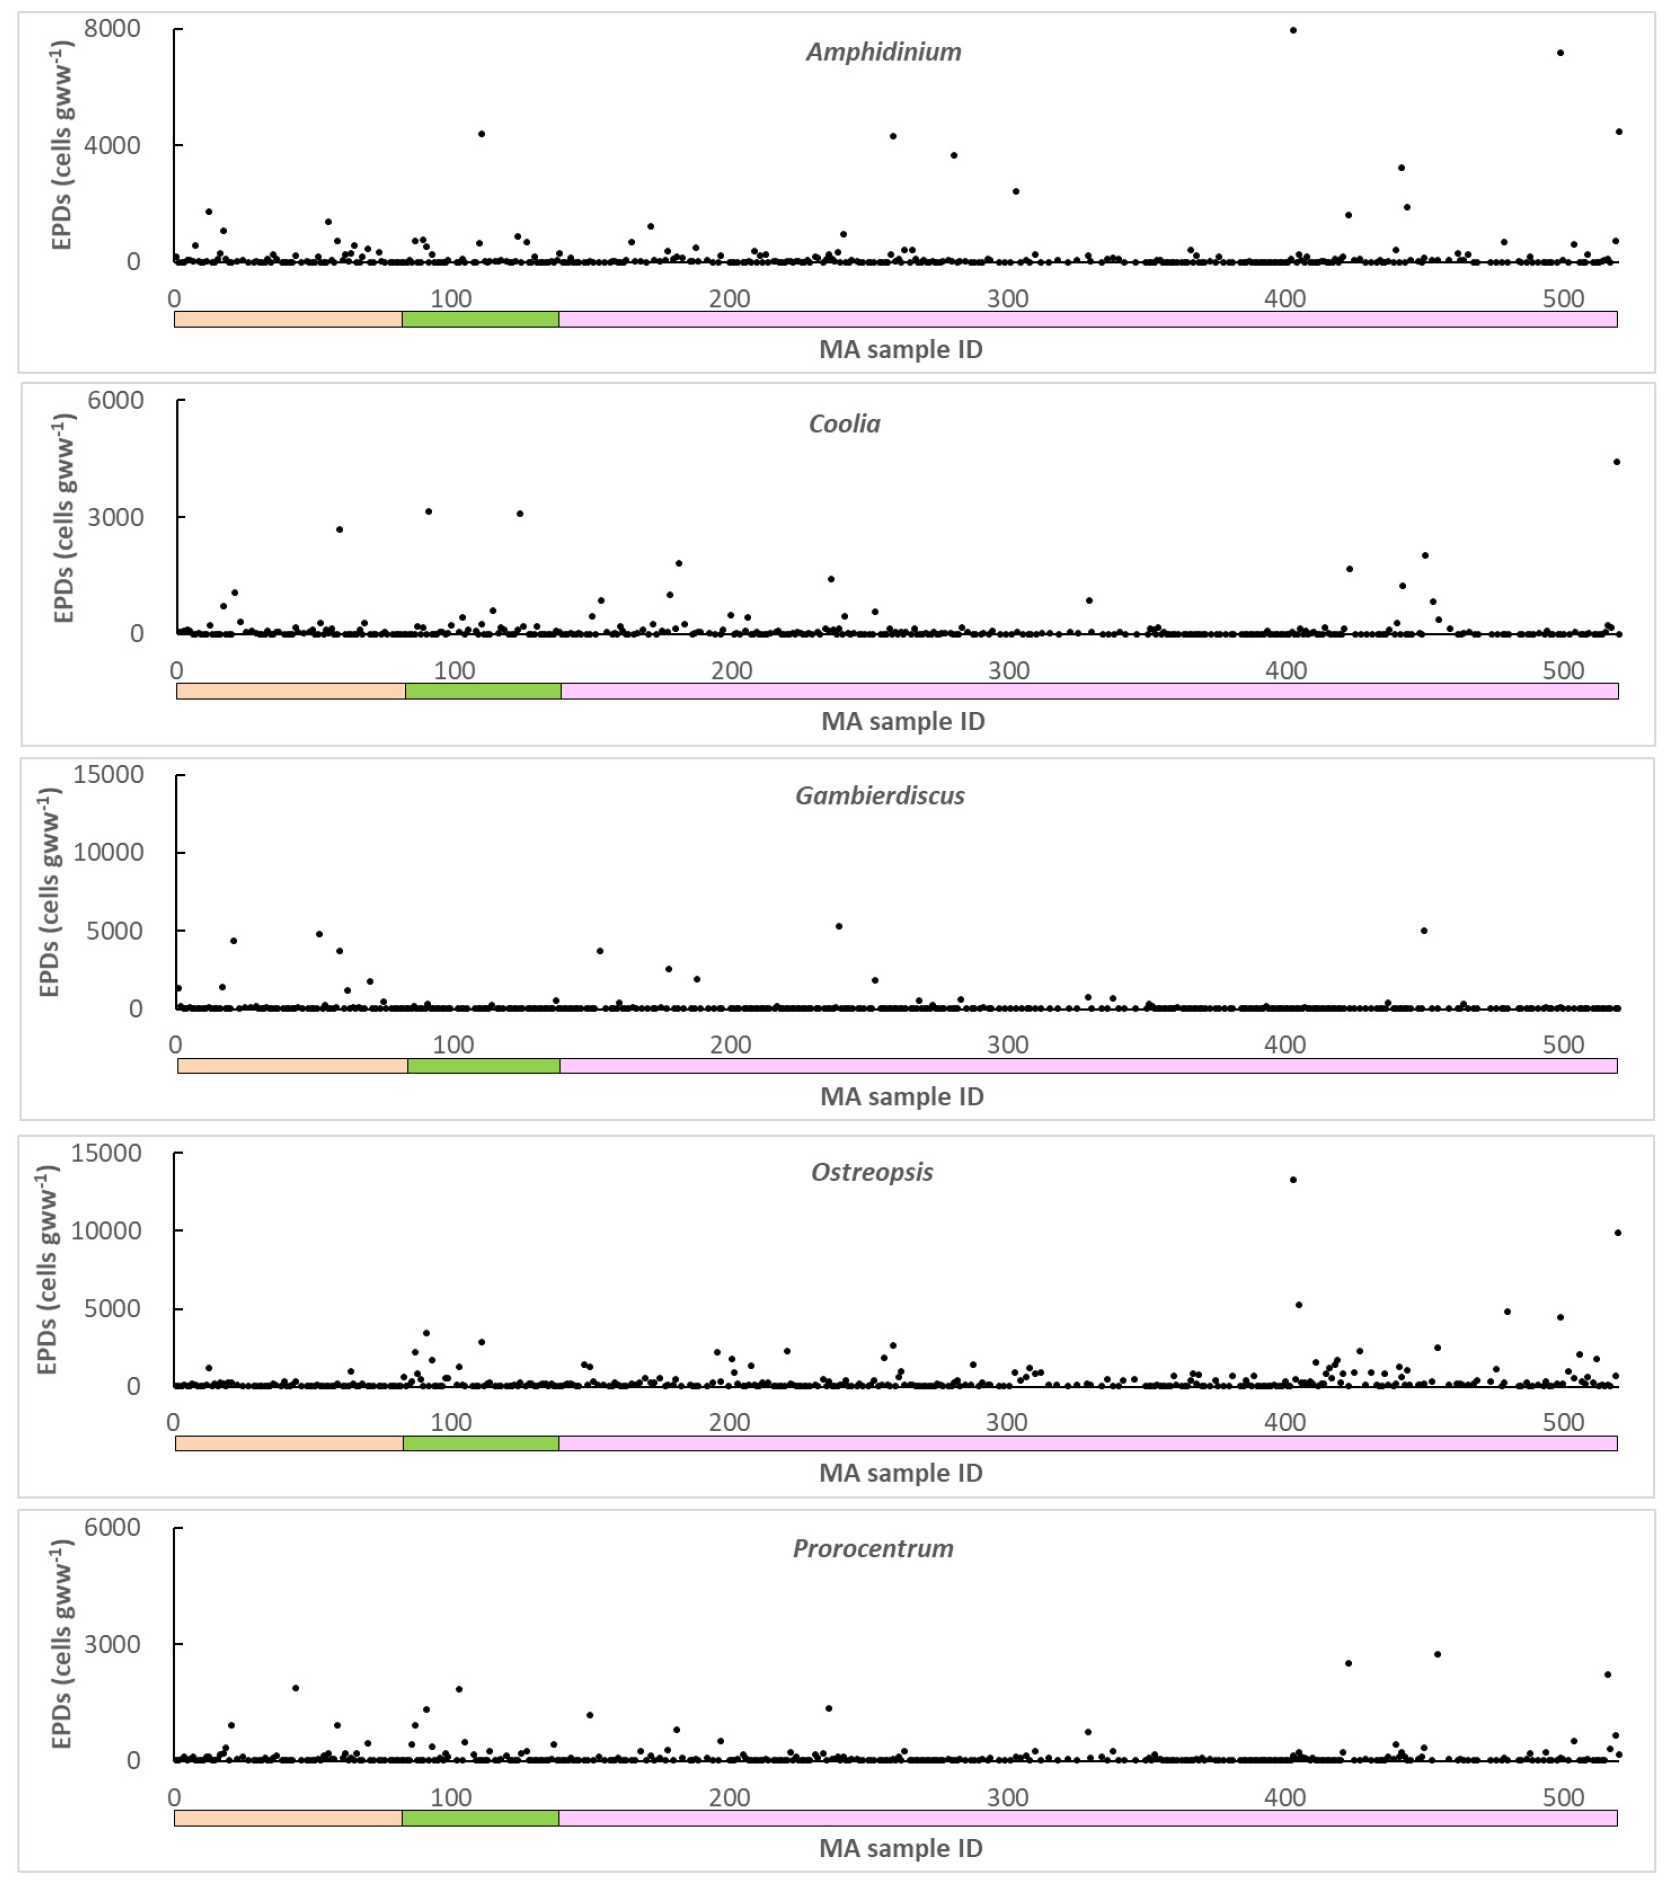
Fig. 3.
EPD genus-specific MA Species Data (cells gww-1) for 391 cumulative MA species representing each of the 36 spatiotemporal sampling points. Colors of the horizontal bars (brown, green, and red) represent three different taxonomic groups of the MA species collected at six stations around Jeju coast.
2.4 MA Sample Data 기반 및 MA Species Data 기반 분석자료 쌍의 산점도 분석
MA Sample Data 및 MA Species Data를 기반으로 한, 두 쌍의 자료처리 값들 사이의 상관성을 비교 분석하였다. 이를 위해, 520개 씩의 각 시료 대표값, 81개 MA 종 각각의 전체 시료 대표 평균값 및 36개 시료 채집점 별 평균값 등에 대하여, EPD 속별로 두 쌍의 해당 자료 간의 관계를 보여주는 산점도를 분석하고, 상관계수 및 결정계수를 서로 비교하였다.
3. 결과 및 고찰
3.1 MA 시료의 조성과 EPD 세포의 출현
520개의 MA 시료를 구성하는 MA 생물종 조성은 갈조류(Brown algae) 14종, 녹조류(Green algae) 13종, 홍조류(Red algae) 54종 등으로 총 81개 종이었으며, 이 가운데 9개 MA 시료의 9개 종(갈조류 1종, 녹조류 4종, 홍조류 4종 등)에서는 EPD 세포가 전혀 나타나지 않아 자료를‘0’으로 처리하였다. 또한 EPD 세포가 나타났던 나머지 72개 MA 종 가운데, 8개 MA 시료의 8개 종(갈조류 1종, 홍조류 7종)에서는 모두 한 종류의 EPD 속인 Ostreopsis 만 확인되어, 결국 64개 MA 종에 속하는 503개의 MA 시료에서 두 가지 이상씩의 EPD 속 세포들이 관찰되었다.
520개의 MA 시료에서 결정된 EPD 5개 속(Amphidinium, Coolia, Gambierdiscus, Ostreopsis, 및 Prorocentrum 속 등)에 대한 MA Sample Data 2600개(Fig. 2 and Table 1)를 정리하여, 36개 시료 채집점 각각을 대표하는 MA 종별 (채집점 별 종수의 누적 합계, 391개)로 EPD 5개 속에 대한 MA Species Data 1955개(Fig. 3 and Table 2)를 산출하였다. 같은 종에 속하는 MA 시료가 한 시료 채집점에서 중복으로 채집된 경우, 여러 가지 종류의 평균값 도출을 위해 각 시료의 개별 평균값을 기반으로 할 것인지(즉, MA Sample Data 기반), 아니면 채집점을 대표하는 MA 종별 평균값을 기반으로 할 것인지(즉, MA Species Data 기반)에 따라 자료 분석 결과에 대한 해석이 달라질 수 있다.
Table 1.
Statistical data including maximum and average values of EPD genus-specific MA Sample Data for 520 MA samples collected from six stations around Jeju coast
Table 2.
Statistical data including maximum and average values of EPD genus-specific MA Species Data for 391 cumulative MA species representing each of the 36 spatiotemporal sampling points around Jeju coast
3.2 조사해역을 대표하는 EPD 속별 총평균 생물량
제주해역을 대표하는 EPD 속별 총평균 생물량을 결정하기 위하여, 적용한 3가지 기준(2.3절 참조)에 따라 계산된 3가지 서로 다른 종류의 총평균 생물량을 계산하였다. 이 세 가지 총평균 생물량 계산치를 서로 비교하여, 전체 조사 해역을 대표하는 총평균 생물량 결정을 위한 최선의 기준이 어느 것인지 검토해 볼 필요가 있다. 어느 해역에서 EPD 생물량의 장기적인 변동을 파악하려면, 해역을 대표하는 총평균 생물량 결정을 위해 일관되게 적용할 표준적인 기준이 우선적으로 필요하기 때문이다.
3.2.1 520개 MA 시료 전체의 EPD 속별 생물량 분포 특성과 총평균 생물량
520개 MA 시료에서 산출된 MA Sample Data 및 MA Species Data의 각 EPD 속별 생물량 최대값은 Amphidinium (7922 cells gww-1로 두 종류의 Data에서 동일)을 제외한 나머지 4개 속에서 모두 MA Species Data에서 MA Sample Data보다 낮았다(Tables 1 and 2). 이는 단일 시료 채집점에서 중복 채집된 동종의 MA 시료 중에서 계수된 복수의 MA Sample Data를 평균하여 해당 시료점을 대표하는 값으로 MA Species Data를 삼았기 때문이다. 각 EPD 속별 생물량 최대값은 Ostreopsis에서가장 높았고(MA Sample Data 기반 및 MA Species Data 기반에서 각각 13366 및 13249 cells gww-1), Prorocentrum (5956 및 2747 cells gww-1)에서 가장 낮게 나타났다(Tables 1, 2). 각 EPD 속별 생물량의 총평균값(기준 1에 의한 조사해역을 대표하는 총평균) 역시 MA Sample Data 기반인 경우와 MA Species Data 기반인 경우가 서로 다르게 나타났는데, Ostreopsis 속의 총평균 생물량은 두 기반 경우(351 및 335 cells gww-1) 모두에서 다른 속에 비해 2배 내외의 높은 최고치가 나타났다(Tables 1 and 2; Fig. 4). Prorocentrum 속의 총평균 생물량은 Ostreopsis 속에 비해 1/3 미만으로 두 기반 경우 모두에서 최저치를 기록하였다. Gambierdiscus 속의 총평균 생물량은 두 기반 경우 모두에서 (145 및 119 cells gww-1) 5개 속 가운데 중간 수준이었는데, 다른 속들과는 달리 최대값과 평균값의 비가 87.4 및 44.1로 가장 높고 전체 520개 시료 가운데 424개에서 Gambierdiscus가출현하지 않은 점을 고려할 때(Tables 1 and 2), 소수의 일부 시료에서 나타난 극히 높은 Gambierdiscus 생물량이 총평균값을 크게 좌우한 것으로 판단된다. EPD 5개 속의 기준 1에 의한 총평균 생물량은 Ostreopsis → Amphidinium → Coolia → Gambierdiscus → Prorocentrum 순서로 작아지는 경향을 보였다(Tables 1 and 2).
MA Sample Data 및 MA Species Data 경우 모두에서 EPD 생물량(cells gww-1) 100을 초과하는 자료의 갯수와 이의 총자료 수 대비 비율(%), 생물량 ‘0’인 자료의 갯수와 이의 총자료 수 대비 비율(%) 등의 네 가지 계산치 모두에서, Ostreopsis와 Gambierdiscus는 5개 EPD 속 가운데 양극단의 최고 또는 최저치를 기록하여, 다른 3개 속과 뚜렷이 대비되는 특성을 나타내었다(Tables 1 and 2). EPD 생물량 100을 초과하는 자료 갯수의 총자료 수 대비 비율(%)을 3개 분류군(갈조류, 녹조류, 홍조류) 별로 세분하여 분석한 결과, 두 경우 모두 갈조류에서는 Gambierdiscus가 최고(33.3% 및 33.3%) Ostreopsis가 최저(7.9% 및 10.1%)를 기록하였다. 이와는 정반대로, 홍조류의 경우에는 Gambierdiscus가 최저치(58.3% 및 54.5%) Ostreopsis가 최고치(82.3% 및 77.7%)를 나타내어(Tables 1 and 2), 갈조류 및 홍조류에 대한 선호도가, MA Sample Data 기반인 경우와 MA Species Data 기반인 경우 모두에서, Gambierdiscus와 Ostreopsis가 양극단에서 서로 정반대임을 시사하였다.
3.2.2 시료의 MA 종을 대표하는 EPD 속별 평균 생물량 분포와 81개 평균의 총평균
520개의 MA 시료 가운데 같은 MA 종에 속하는 시료군 81개 각각의 EPD 속별 평균 생물량(Figs. 5 and 6) 가운데 최대값은 5개 속 가운데 Prorocentrum (MA Sample Data에서 708, MA Species Data에서 840 cells gww-1)에서 가장 작았다. 나머지 4개 속 모두에서는 MA Species Data 기반과 MA Sample Data 기반에서 계산한 평균 생물량의 최대값이 동일하였는데, 이 가운데, Ostreopsis에서최고값이 나타났고(9873 cells gww-1), Amphidinium, Coolia, Gambierdiscus 순으로(각각 4466, 4400 및 2367 cells gww-1) 낮아졌다(Tables 3 and 4). 이 최대치의 속별 순위에서 Ostreopsis가 1위이고 Prorocentrum이 5위인 점은 기준 1에 의한 결과와 일치하였다(Tables 1, 2, 3, 4).
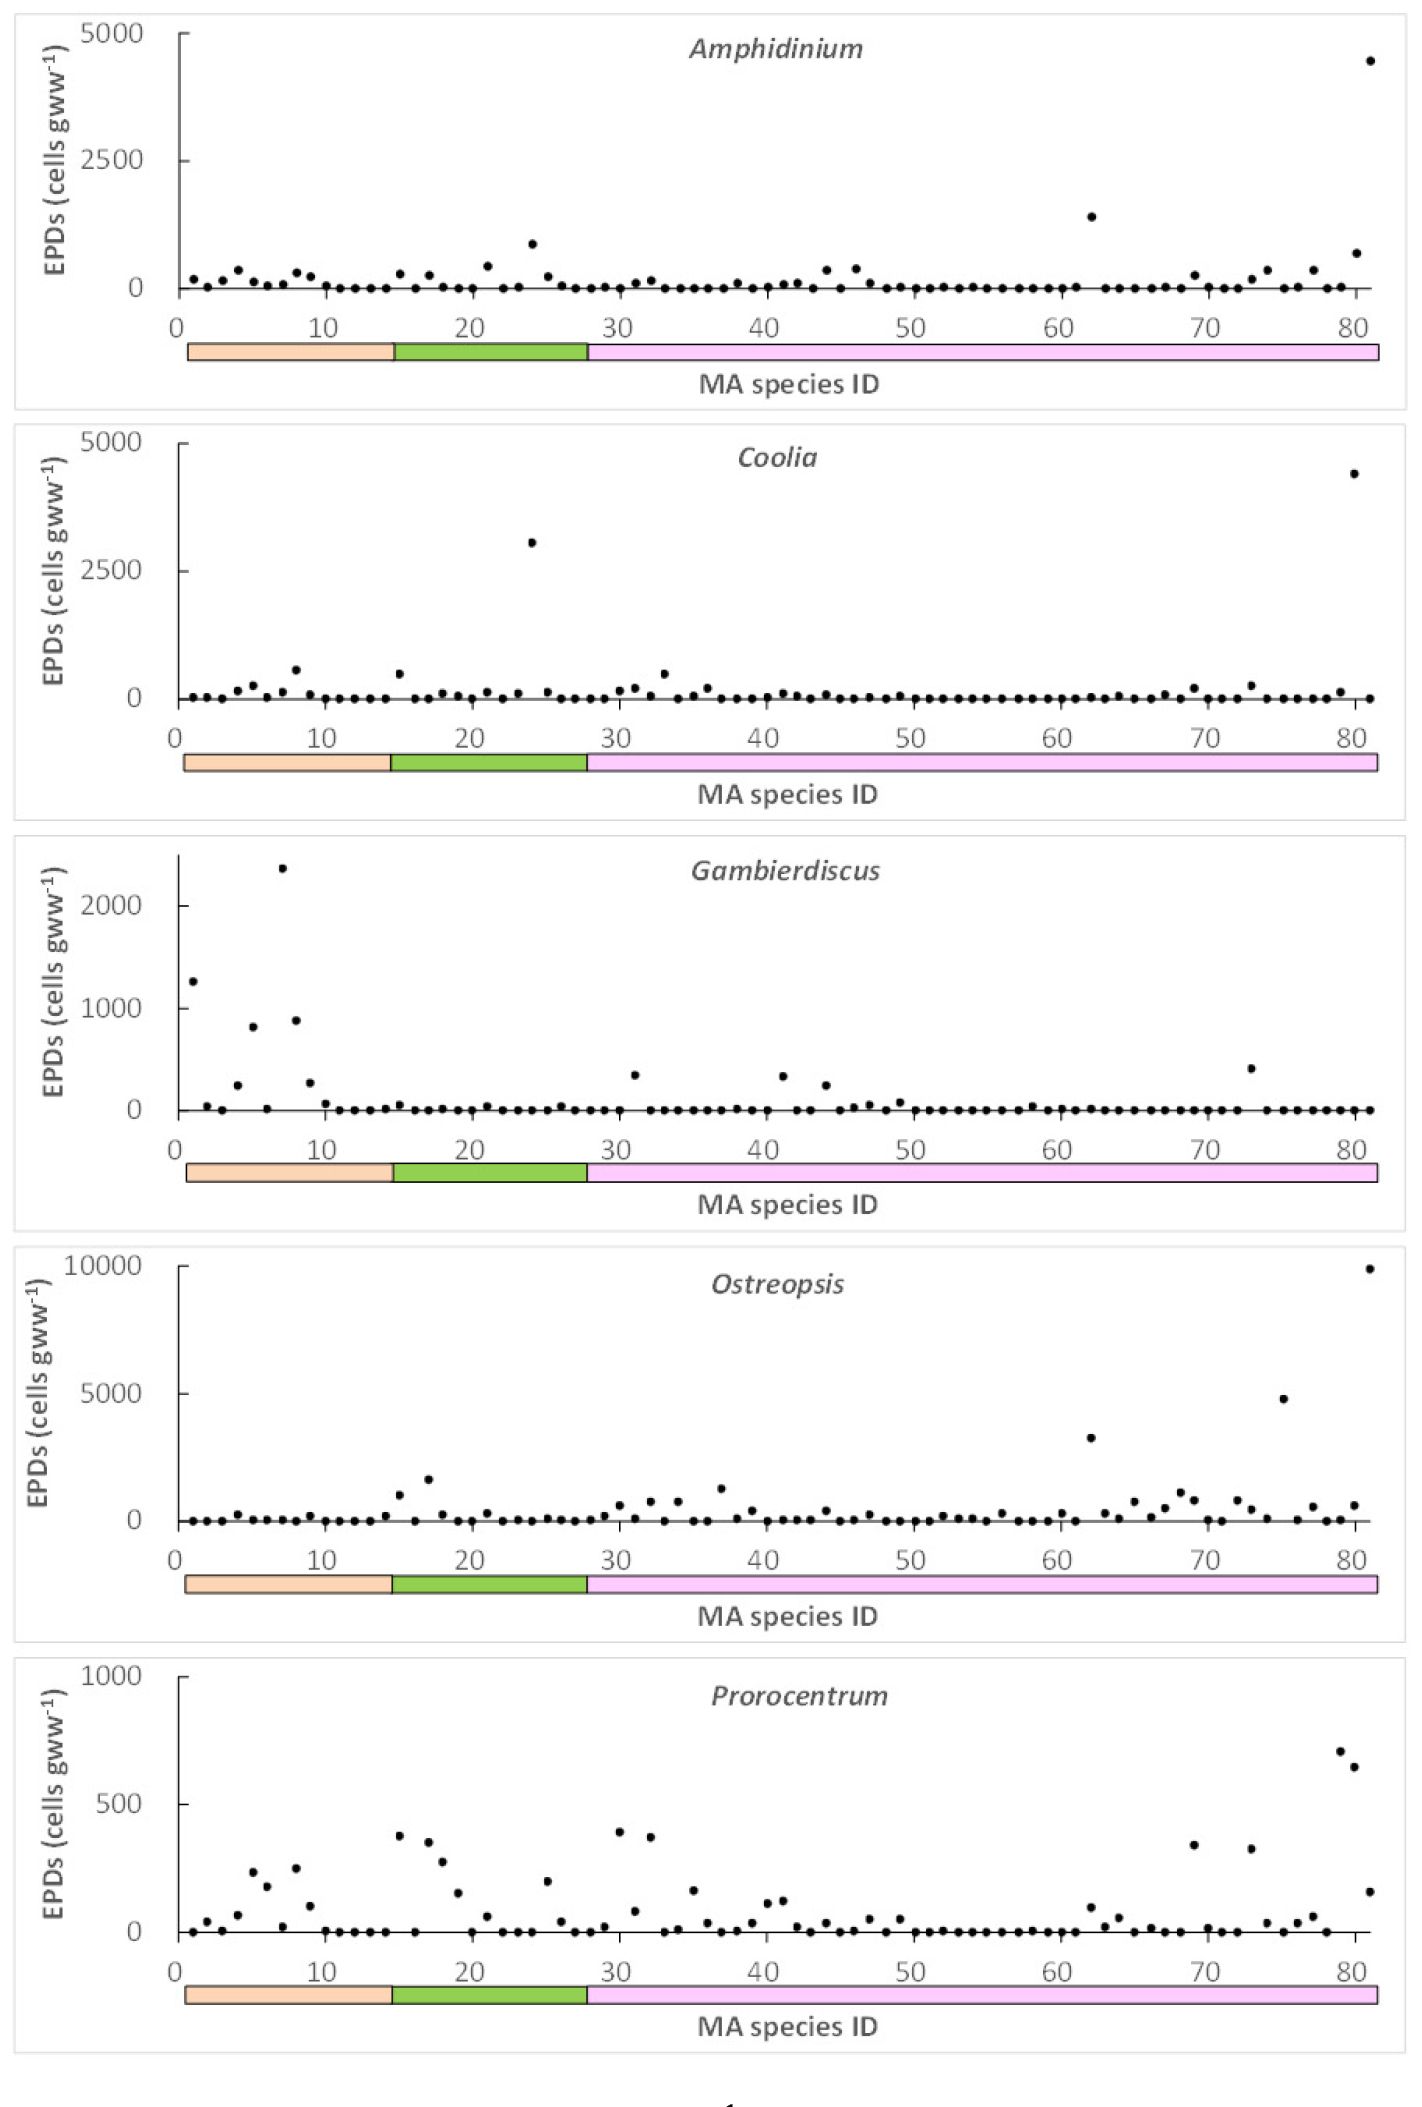
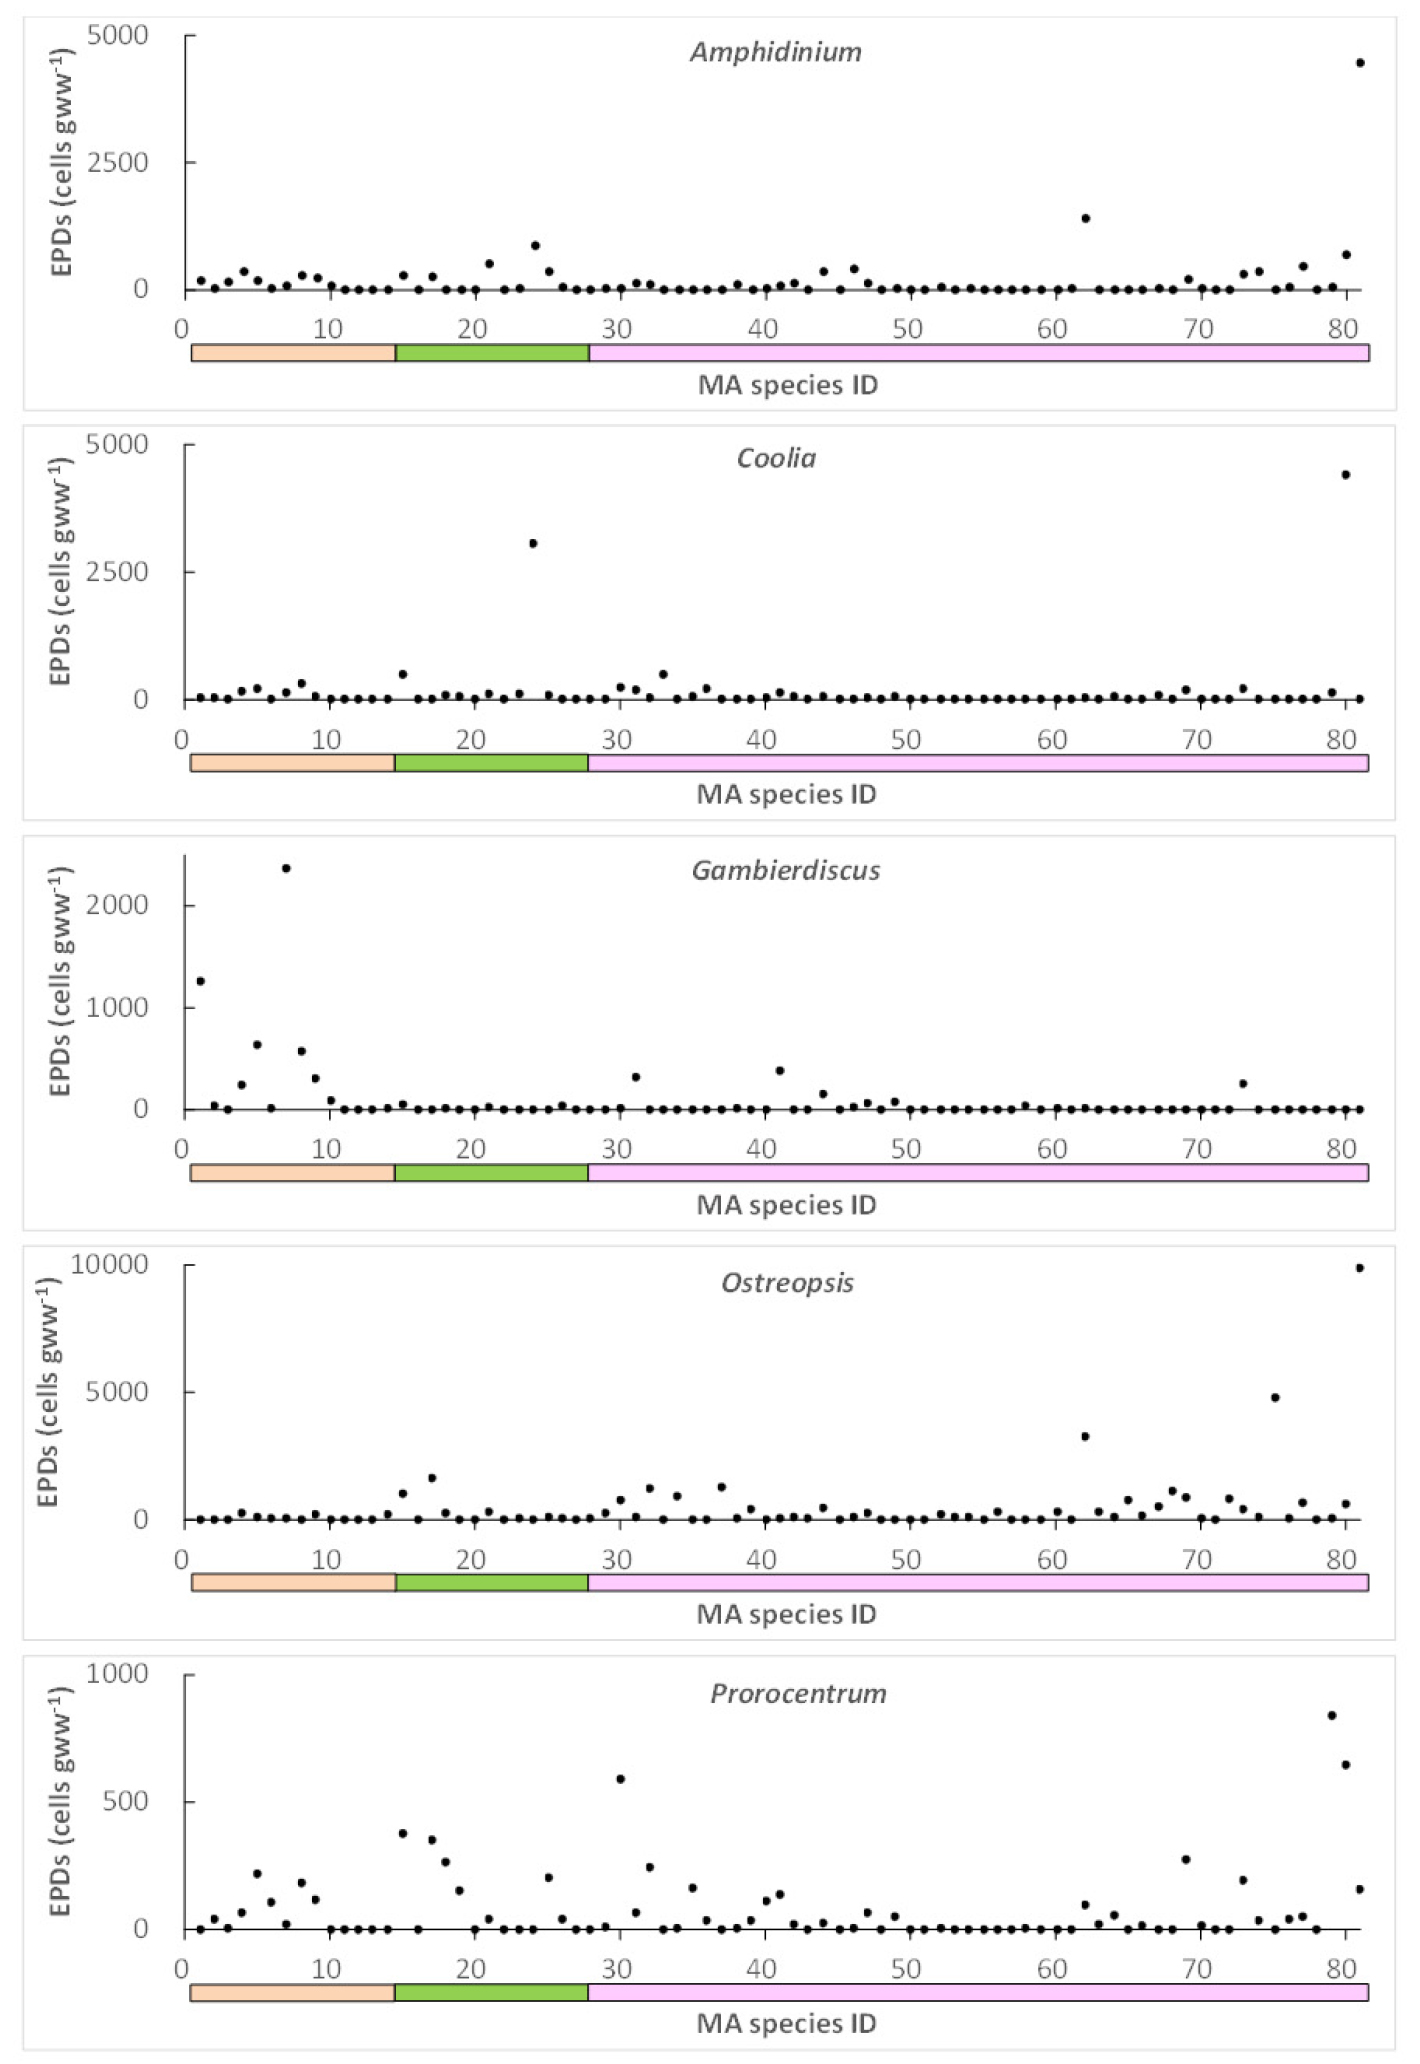
Table 3.
Statistics based on MA Sample Data including maximum and grand average of MA species-specific genus-specific means of EPD abundance for 81 samples groups representing 81 MA species collected from the Jeju coast
Table 4.
Statistics based on MA Species data including maximum and grand average MA species-specific genus-specific means of EPD abundance for 81 samples groups representing 81 MA species collected from the Jeju coast
이들 81개씩의 속별 평균 생물량의 총평균(기준 2에 의한 조사해역을 대표하는 총평균)은 MA Sample Data 기반인 경우와 MA Species Data 기반인 경우 사이에 근소한 차이를 보였는데(Tables 3 and 4; Fig. 7), Ostreopsis 속의 총평균 생물량은 두 경우 모두(441 및 451 cells gww-1) 다른 속에 비해 3배 내외의 높은 값을 나타내었다. 이 값은 두 경우 모두 기준 1에 의한 Ostreopsis 속의 총평균 값(351 및 335 cells gww-1, Tables 1 and 2) 에 비해 뚜렷하게 높았는데, 마찬가지로 Coolia 속의 총평균 생물량에서도 기준 2에 의한 두 경우(154 및 148 cells gww-1, Tables 3 and 4)가 기준 1에 의한 총평균 값(118 및 104 cells gww-1, Tables 1 and 2)보다 월등히 높게 나타났다. 반면에, Gambierdiscus 속의 총평균에서는 기준 2에 의한 두 경우(95 및 87 cells gww-1, Tables 3 and 4)가 기준 1에 의한 총평균 값(145 및 119 cells gww-1, Tables 1 and 2)보다 오히려 낮게 나타났다. 이는 총평균 계산을 위해 적용하는 기준에 따라 총평균 값 자체도 달라질 뿐만 아니라, 그 차이의 방향성도 EPD 속 간에도 서로 바뀔수 있다는 연구 사례로서, 총평균 계산을 위한 기준의 표준화가 필요함을 시사한다. 그러나, 기준 1과 기준 2에 의한 EPD 속별 총평균 생물량의 공통된 속별 순위(Ostreopsis → Amphidinium → (Coolia 또는 Gambierdiscus)→ Prorocentrum)는 서로 일치하여, 두가지 기준 모두에서 제주해역의 전반적인 생물량 상대비의 경향을 잘 반영하였다(Tables 1, 2, 3, 4).
MA Sample Data 및 MA Species Data 경우, EPD 생물량(cells gww-1) 100을 초과하는 자료의 갯수와 이의 총자료 수 대비 비율(%), 생물량 ‘0’인 자료의 갯수와 이의 총자료 수 대비 비율(%) 등 네 가지 계산치 모두 Ostreopsis와 Gambierdiscus는 5개 속 가운데 최고 또는 최저치를 기록하여, 이들 계산치의 상대적인 분포에 있어 다른 3개 속과 뚜렷이 대비되는 특성을 나타내었다(Tables 3 and 4). EPD 생물량 100을 초과하는 자료 갯수의 총자료 수 대비 비율(%)을 3개 분류군(갈조류, 녹조류, 홍조류) 별로 세분하여 분석한 결과, 두 경우 모두 갈조류에서는 Gambierdiscus가 최고(60.0%) Ostreopsis가 최저(8.1%)를 기록한 것과 정반대로, 홍조류의 경우에는 Gambierdiscus가 최저(40.0%) Ostreopsis가 최고(78.4%)로 나타났다(Tables 3 and 4). 갈조류 및 홍조류에 대한 선호도가, MA Sample Data 기반인 경우와 MA Species Data 기반인 경우 모두에서 Gambierdiscus와 Ostreopsis가 양극단에서 서로 정반대로 나타났다. 녹조류의 경우는 그 비율이 Gambierdiscus에서 0% Ostreopsis에서 13.5% 수준으로, 20.0~31.6% 범위를 보인 나머지 3개 속(Amphidinium, Coolia, 및 Prorocentrum 속 등)에 비해 뚜렷이 낮은 값을 나타내었다(Tables 3 and 4).
3.2.3 36개 시료 채집점을 대표하는 EPD 속별 평균 생물량 분포와 총평균 값
520개의 MA 시료를 구성하는 시공간적인 36개 시료 채집점(6개 정점 x 격월간 6회) 각각에서 MA 종을 통틀어 MA Sample Data 및 MA Species Data의 EPD 속별 평균 생물량(시료 채집점 별-EPD 속별 평균 생물량)을 구하였다(Figs. 8 and 9). EPD 속별 36개씩의 평균 생물량 가운데 최고치는 Amphidinium이MA Sample Data 및 MA Species Data 경우 모두에서 2968 및 3011 cells gww-1로 가장 높게 나타나 Ostreopsis와 그 다음의 Gambierdiscus와 함께 최고 평균생물량이 높운 수준인 속들을 구성하였고, 반면 Coolia와 Prorocentrum은 월등히 낮은(1239-1773 cells gww-1) 최고 생물량을 나타내었다(Tables 5 and 6). 속별 평균생물량의 최고치와 최저치가 각각 Ostreopsis와 Prorocentrum에서 나타나, 본 기준 3을 포함한 속별 총평균 계산에 적용한 세 가지 기준 모두의 경우에서 일관된 경향을 보였다(Tables 1, 2, 3, 4, 5, 6).

속별로 36개씩의 평균생물량에서 계산된 속별 총평균 값(즉, 기준 3에 의한 조사해역을 대표하는 총평균) 가운데, Ostreopsis가 MA Sample Data 및 MA Species Data 모두에서 2배 내외의 높은 값을 기록하였다(Fig. 10; Tables 5 and 6). 두 경우 모두 총평균 생물량에서 Ostreopsis (356 및 327 cells gww-1)와 Prorocentrum (114 및 102 cells gww-1)은 각각 월등한 최고치와 뚜렷한 최저치로 3개의 기준 모두(총평균 계산에 적용한 기준 1, 2, 3)에서 일치된 경향을 나타내어(Tables 1, 2, 3, 4, 5, 6), 이 두 속이 제주해역을 대표하는 3가지 기준의 속별 총평균값 모두에서 각각 양극단에 있음을 확인할 수 있었다. 또한 기준 3에 의한 총평균 생물량의 순위 역시 Ostreopsis → Amphidinium → (Coolia 또는 Gambierdiscus)→ Prorocentrum로 나타나, 3개의 기준 모두에서 일관된 순위를 보인 셈이다. 따라서 3개의 기준으로 도출된 EPD 속별 총평균 생물량의 절대값은 서로 다르다 하더라도, 상대적인 생물량 순위는 어느 기준을 적용하더라도 변함이 없음을 확인하였다(Tables 1, 2, 3, 4, 5, 6).
MA Sample Data 및 MA Species Data 모두에서 EPD 생물량(cells gww-1) 100을 초과하는 자료의 갯수와 이의 총자료 수 대비 비율(%), 1 미만인 자료의 갯수와 이의 총자료 수 대비 비율(%) 등 네 가지 계산치 모두 Ostreopsis와 Gambierdiscus는 5개 속 가운데 최고 또는 최저치를 기록하여, 이들 계산치의 상대적인 분포에 있어 다른 3개 속과 뚜렷이 대비되는 특성을 나타내었다(Tables 5 and 6). 이러한 특성은 총평균 생물량 계산을 위한 기준 1, 2, 3 모두의 경우에 일관되게 나타나, 제주해역에서 Ostreopsis의 상대적인 최고 균일분포와 Gambierdiscus의 상대적인 최고 불균일분포라는 일관된 특징을 잘 나타내었다(Tables 1 and 6).
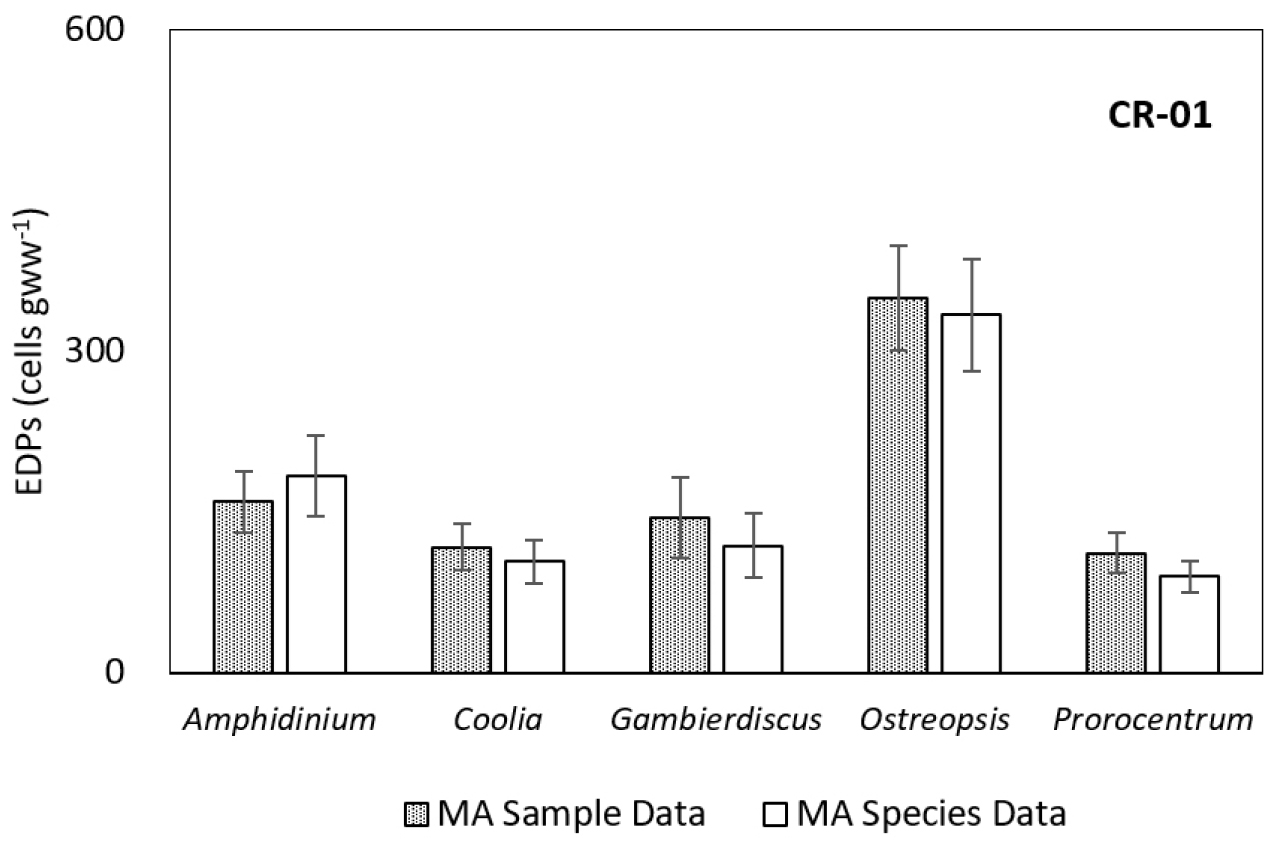
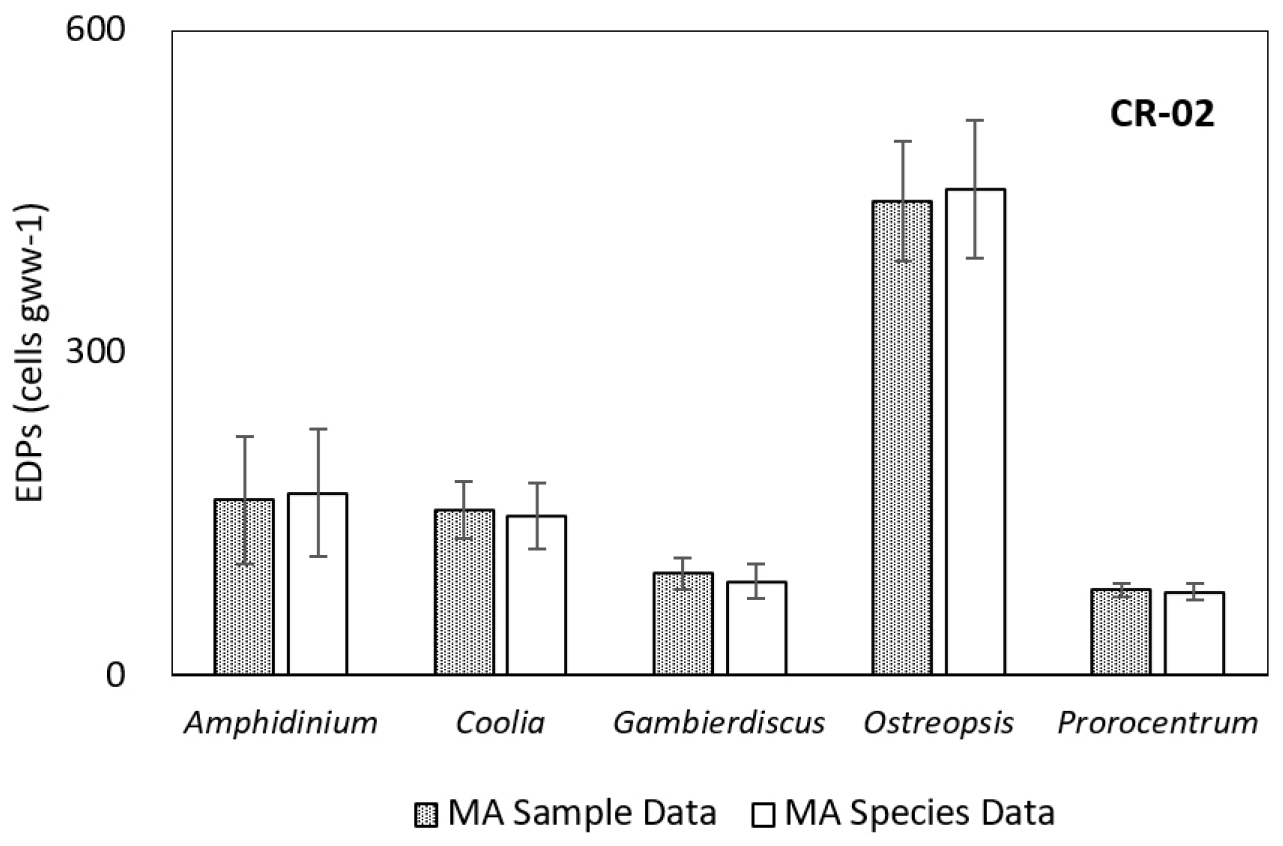
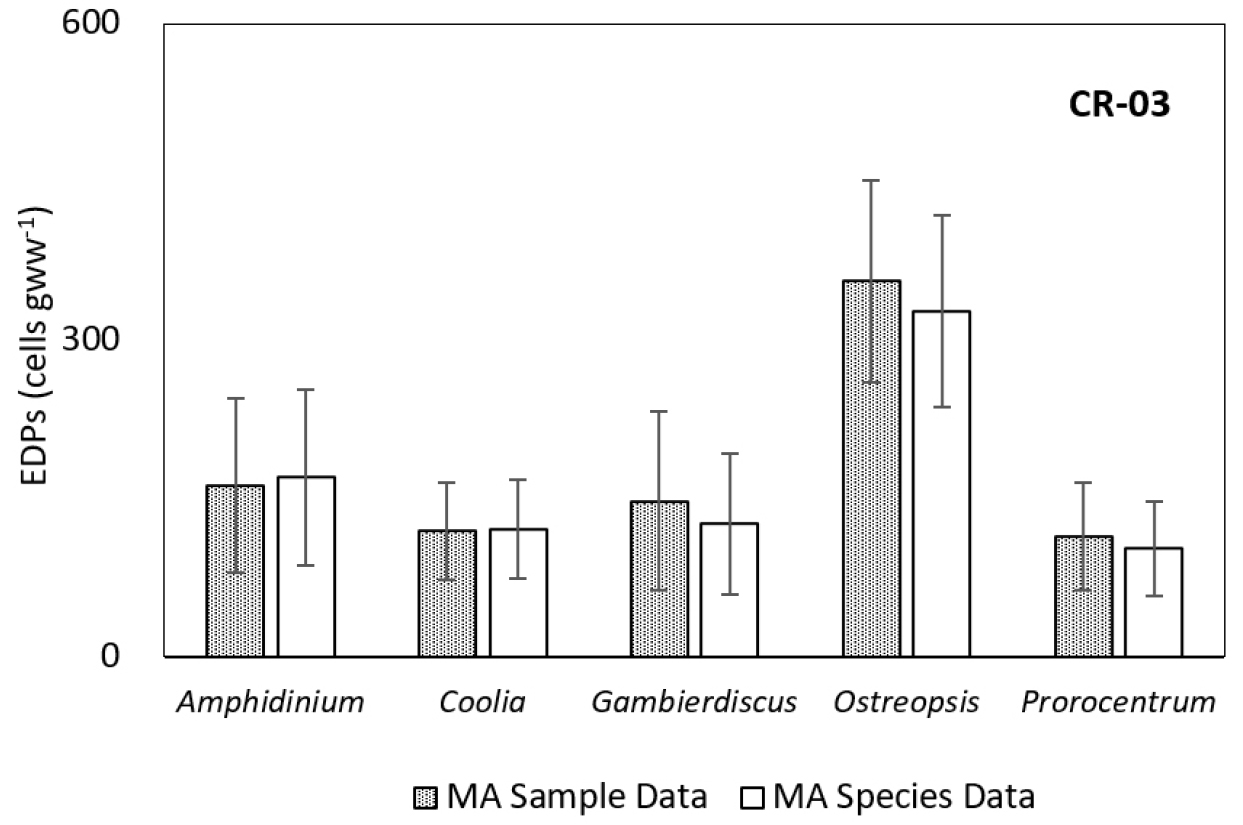
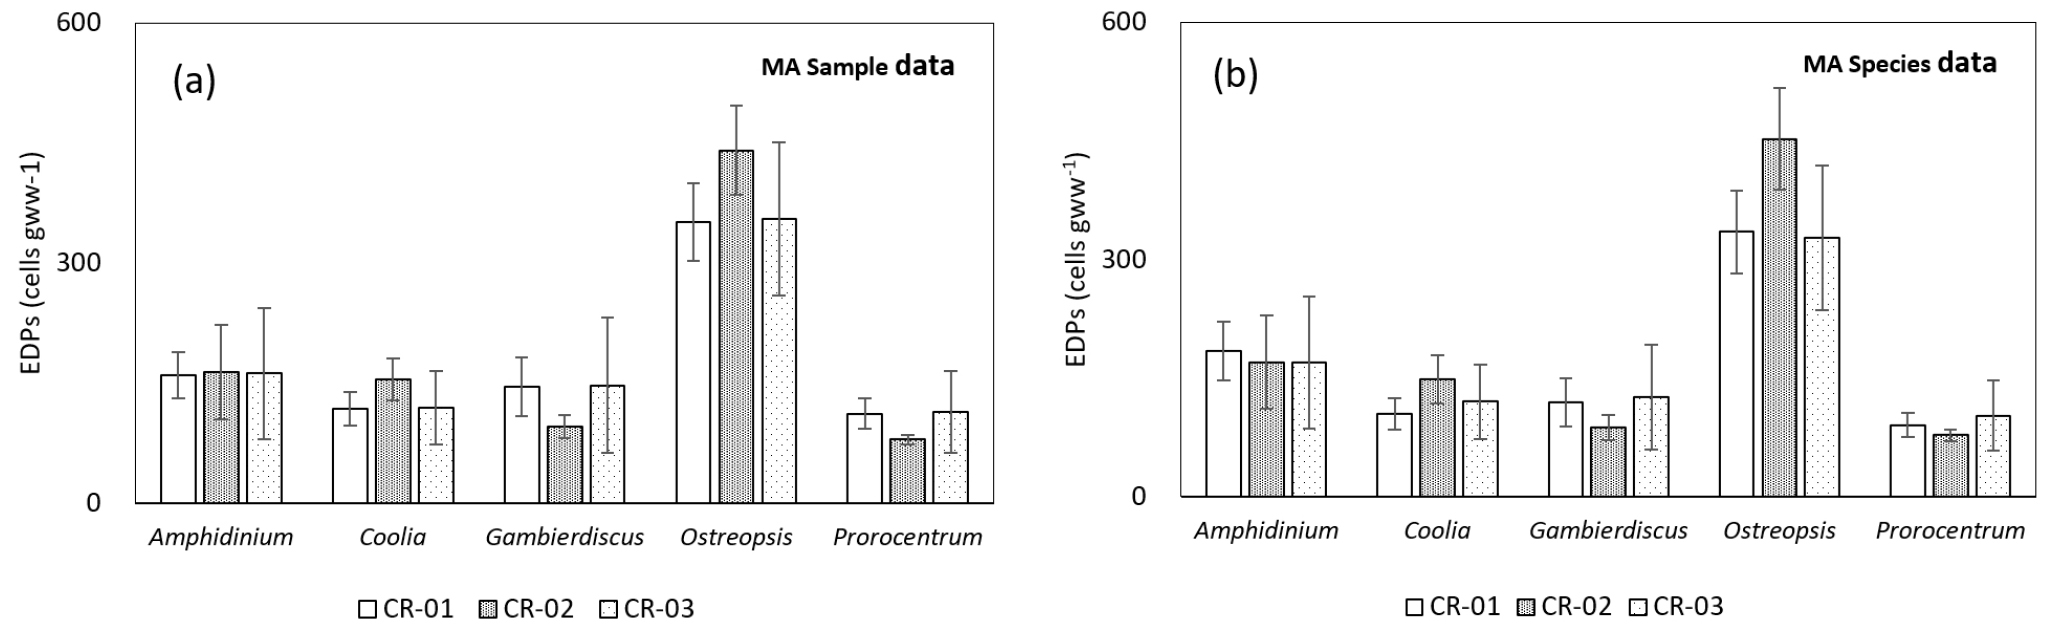
또한, MA Sample Data (Fig. 11(a)) 및 MA Species Data (Fig. 11(b)) 기반으로 각기 계산한 경우, 모두 제주해역을 대표하는 EPD 총평균 생물량간 계산을 위한 세 가지 기준에 의한 총평균 생물량간의 차이(세가지 기준 간의 차이)를 확인할 수 있었다. 세 기준에 따른 총평균치가 거의 대부분 통계적으로 유의한 수준의 차이를 보이지는 않았다 하더라도(CR-01, CR-02, and CR-03 in Fig. 11), 향후의 유사한 연구결과를 비교하기 위해서라도 세 가지 기준 가운데 어느 것이 조사해역을 대표하는 최적의 총평균값을 결정하기 위하여 가장 적합한 것인지에 대한 추가적인 논의가 필요할 것으로 보인다. 그러나, 조사 해역에서 EPD 속별 생물량의 시공간적인 분포를 다루어야 할 경우에는, 부득이 세 번째 기준에 따른 36개 시료채집점 평균의 총평균(CR-03 in Fig. 11)이 실질적으로 세 가지 기준 가운데 최선일 것이다.
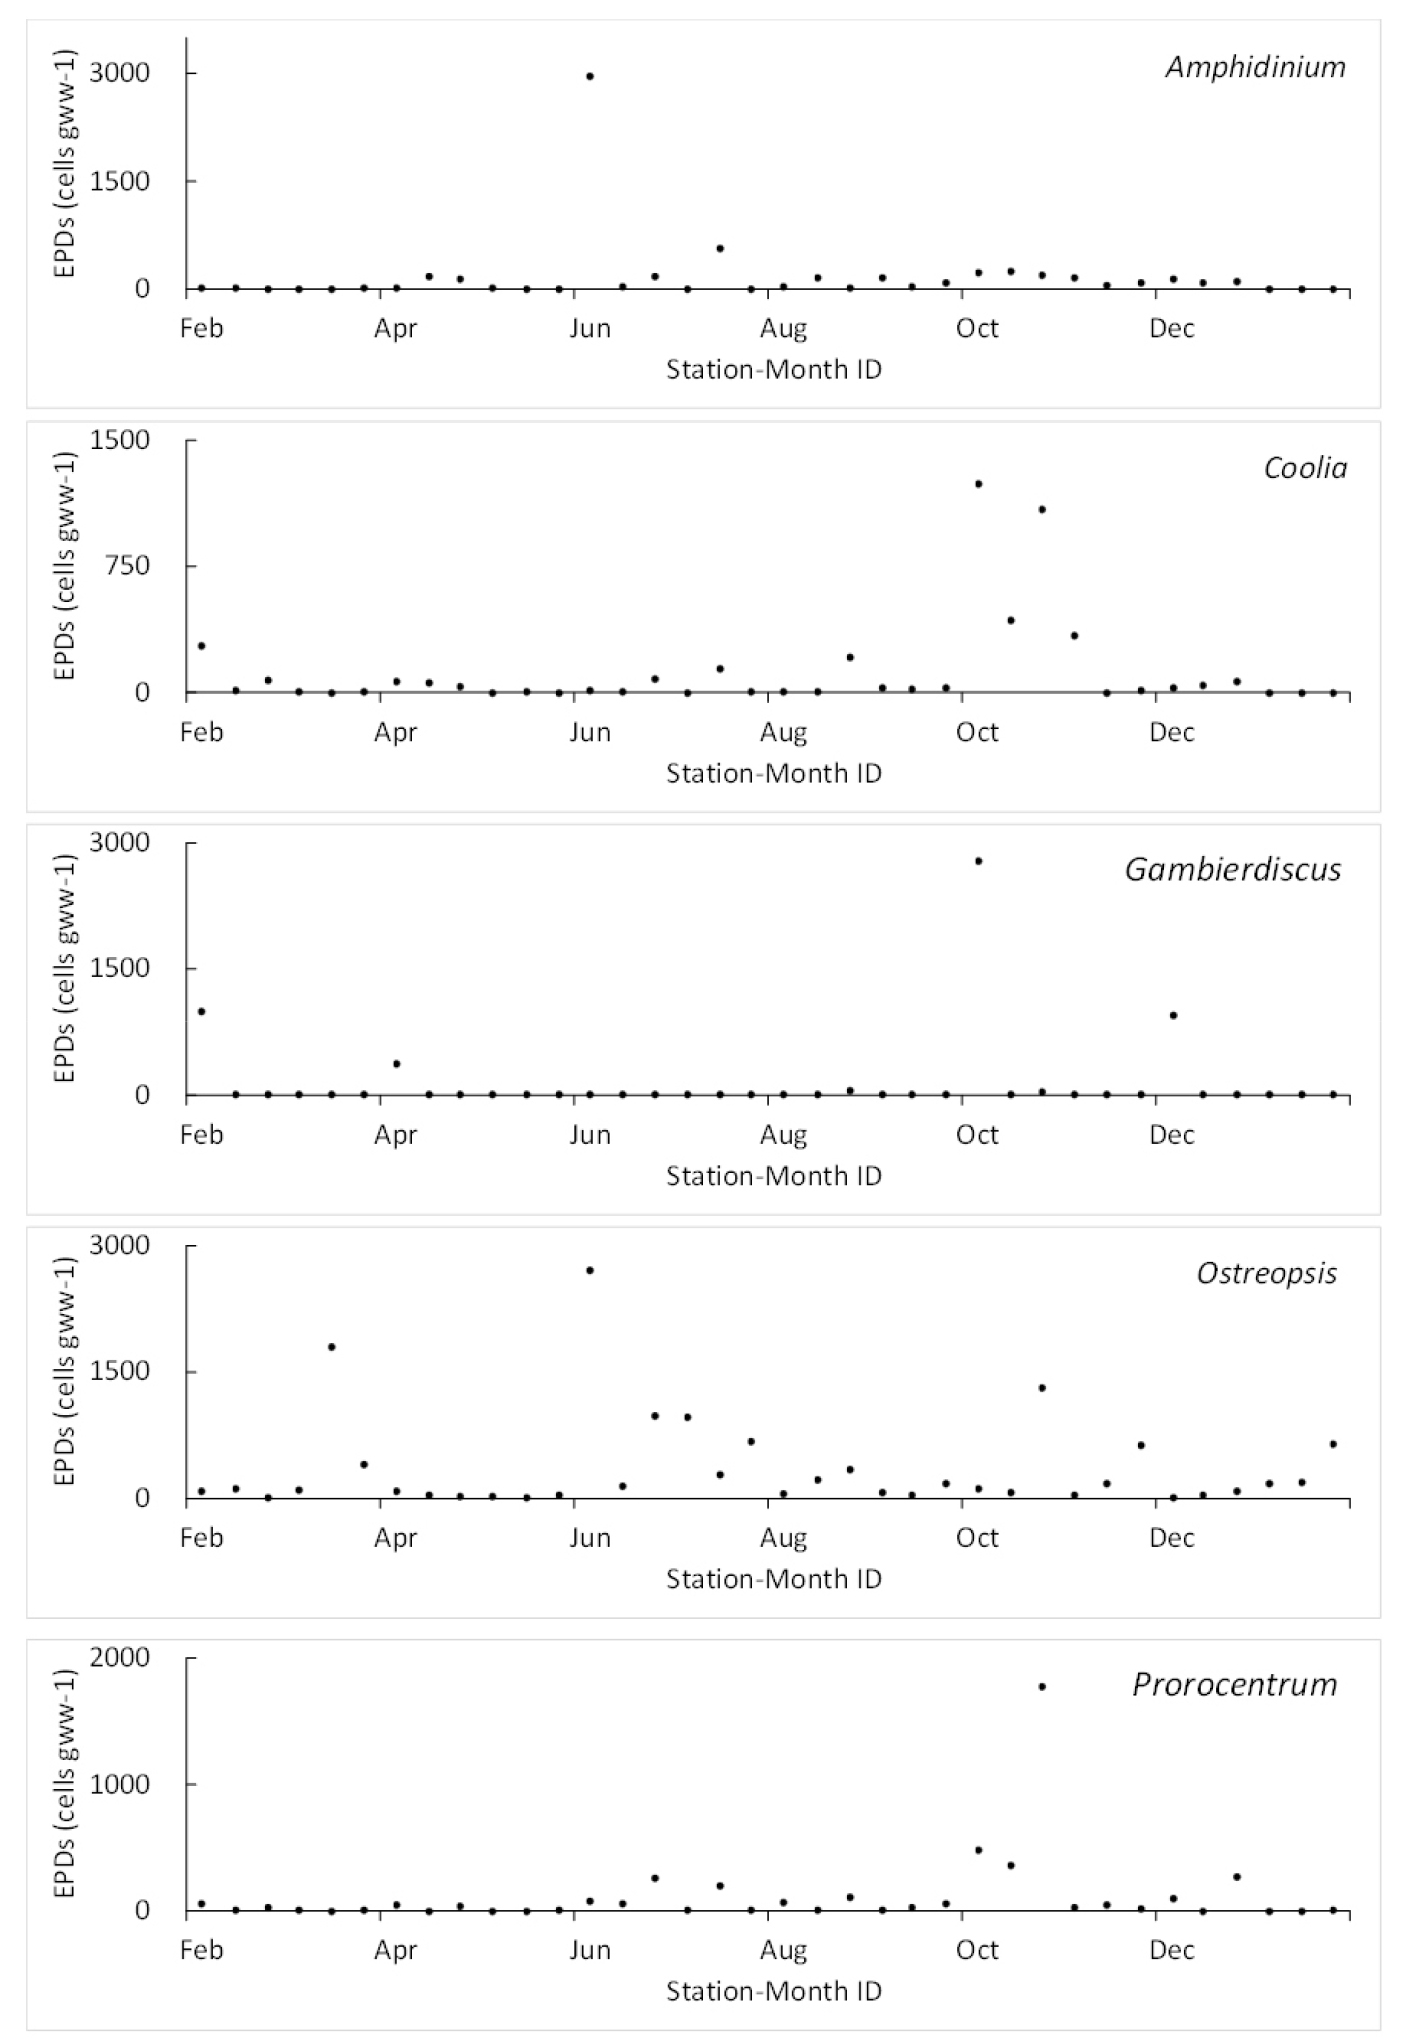
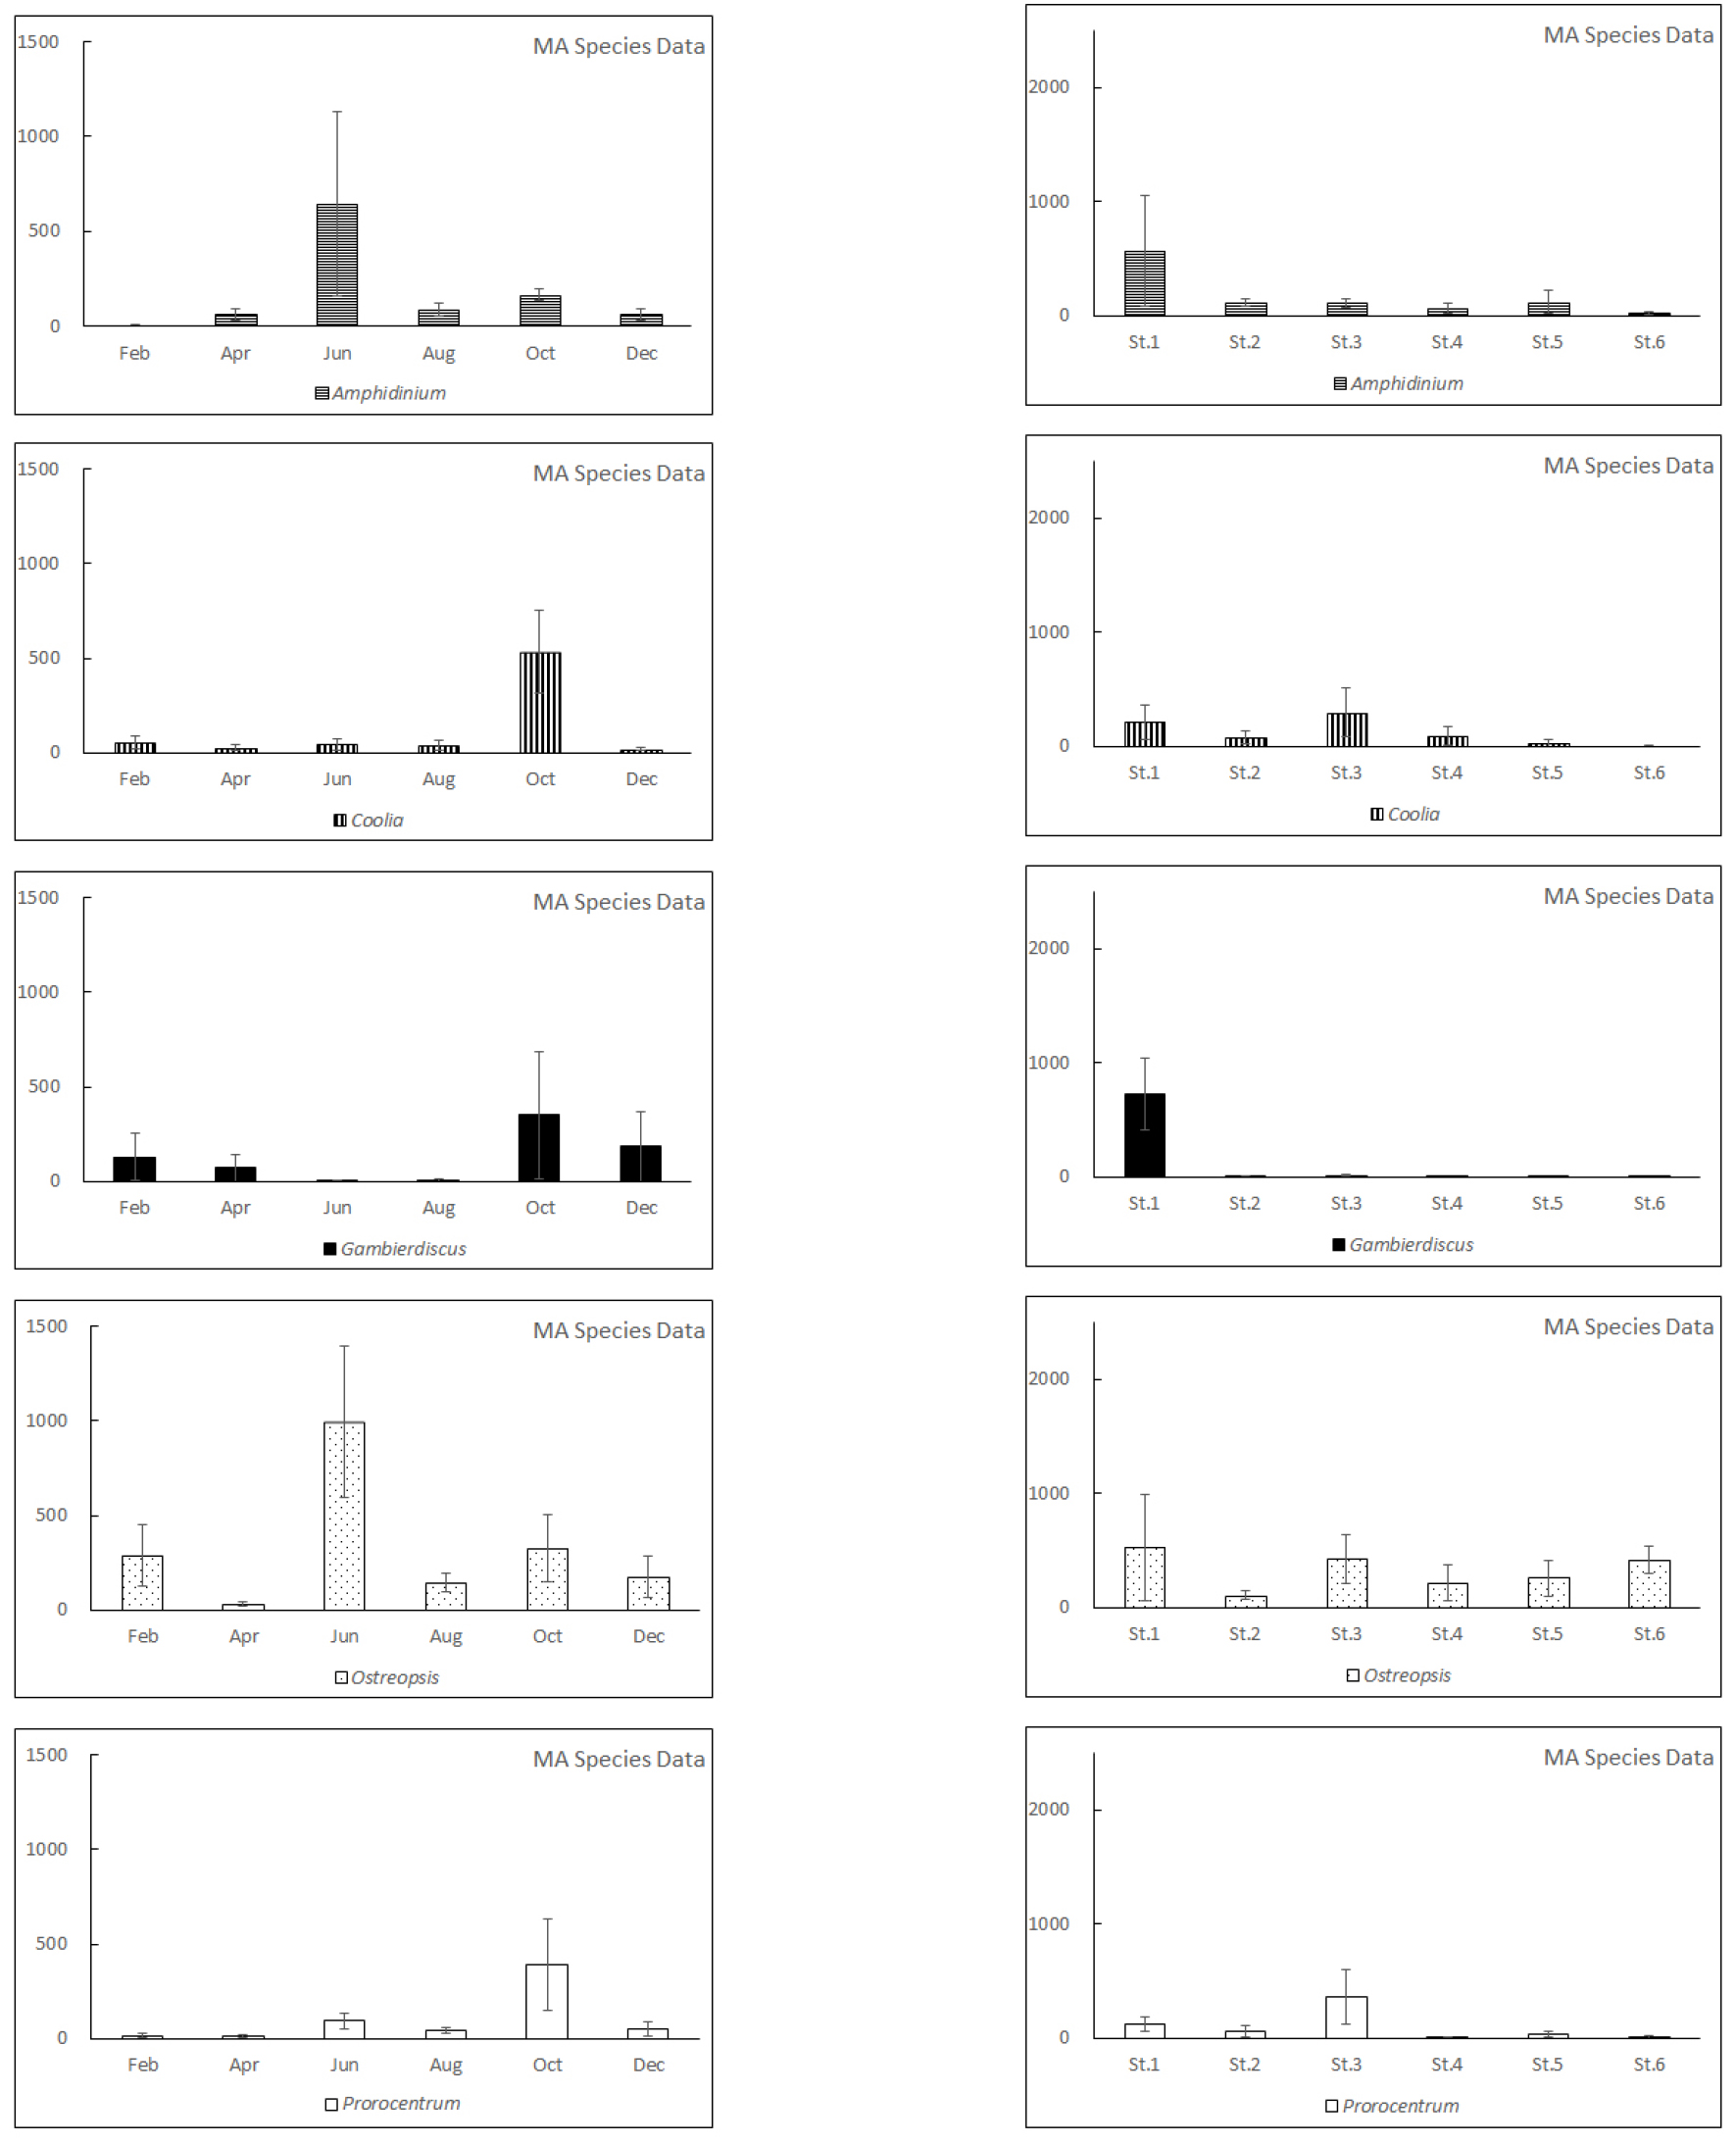
3.3 시료 채집점 36개의 EPD 속별 평균 생물량과 시공간적 분포
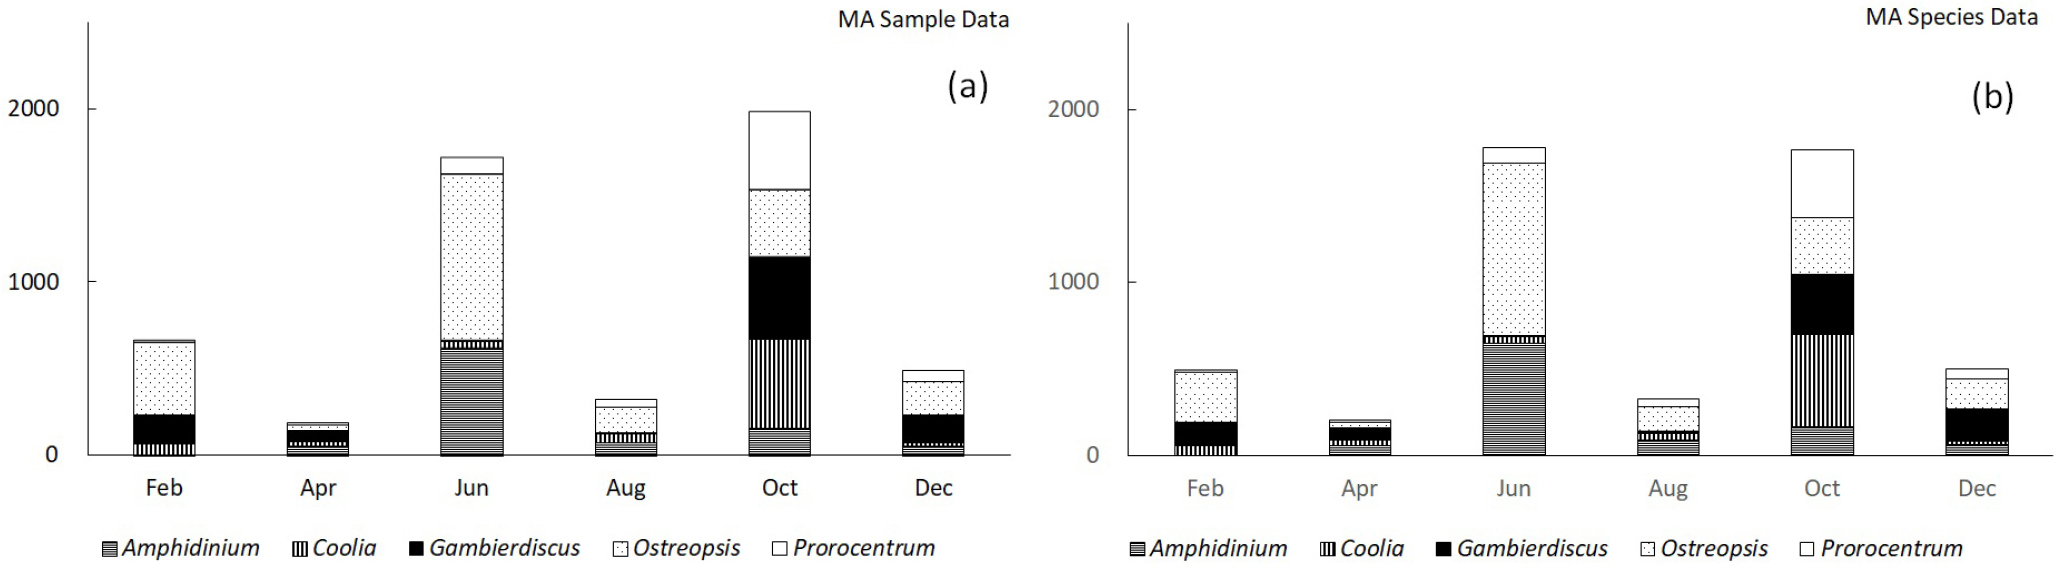
36개 시료 채집점을 대표하는 5개씩의 EPD 속별 평균 생물량을 월별(Fig. 12)로 구분한 누적 막대그래프에서, 6개 정점 평균값은 6월과 10월에 다른 시기에 비해 최소 2배 이상의 높은 값을 보였으며(Figs. 12(a) and 12(b)), 계절과 관계없이 Ostreopsis는 높은 생물량 상대비를 나타내었다. 이와는 대조적으로 Amphidinium과 Coolia는 각각(6월과 10월) 및 (10월) 등의 1-2 시기에만 우점을 나타내어, 년 중 4회에 걸쳐 상당한 생물량을 기록한 Gambierdiscus와 Prorocentrum 등과 차이를 나타내었다(Figs. 12(a) and 12(b)). 제주해역에서 MA의 생물량이 최고가 되는 시기로 알려진 4월(Kim et al., 2018)에 상대적으로 가장 낮은 월별 누적 생물량이 기록된 것(Fig. 12)은 예상 밖의 결과로, 그 원인에 대하여 추가적인 연구가 필요하다.
6개 조사 시기를 평균한 정점별 누적 막대그래프(Figs. 13(a) and 13(b))에서는 정점 1이 뚜렷한 최고치를 보였으며, 다음으로 정점 3도 기타 정점(2, 4, 5, and 6) 대비 2배 내외의 높은 값을 나타내어, 정점 간 EPD 생물량 평균값의 분포가 매우 불균일하였다. 최대값을 보인 정점 1과 최소값을 보인 정점 4는 제주도의 동서 쪽 양 끝에 있는 정점으로 동서 간의 극단적인 대조를 나타내었다. 이 두 정점 간의 누적생물량이 극단적으로 차이를 나타내는 현상은 두 정점간의 해양물리학적 특징의 차이로도 설명할 수 있다. 즉, 정점 1(성산: 성산리 성산일출해양공원승선장 인근 수역)은 제주도 동쪽 해안의 중간적 위도에 위치하여 제주 난류(Jeju Warm Current, JWC)에 의한 물리적인 교란의 영향이 거의 없고 보호된 소만의 안쪽에 위치하여 수층 간의 안정성이 높은 환경으로, 6개 정점 가운데 EPD 세포들이 MA 표면에서 서식하기에 매우 적절한 여건을 갖추고 있다. 한편, 정점 4는 제주 난류의 흐름과 관련된 상층의 용승과 조석혼합에 의한 저층의 수직적 혼합상태(Kim and Lee, 1982; Pang and Kim, 1993)가 동시에 유지되는 정점으로, 수직혼합 및 수층의 교란 강도가 높아 EPD의 부착, 서식, 성장 등의 측면에서 가장 불리한 환경이다.
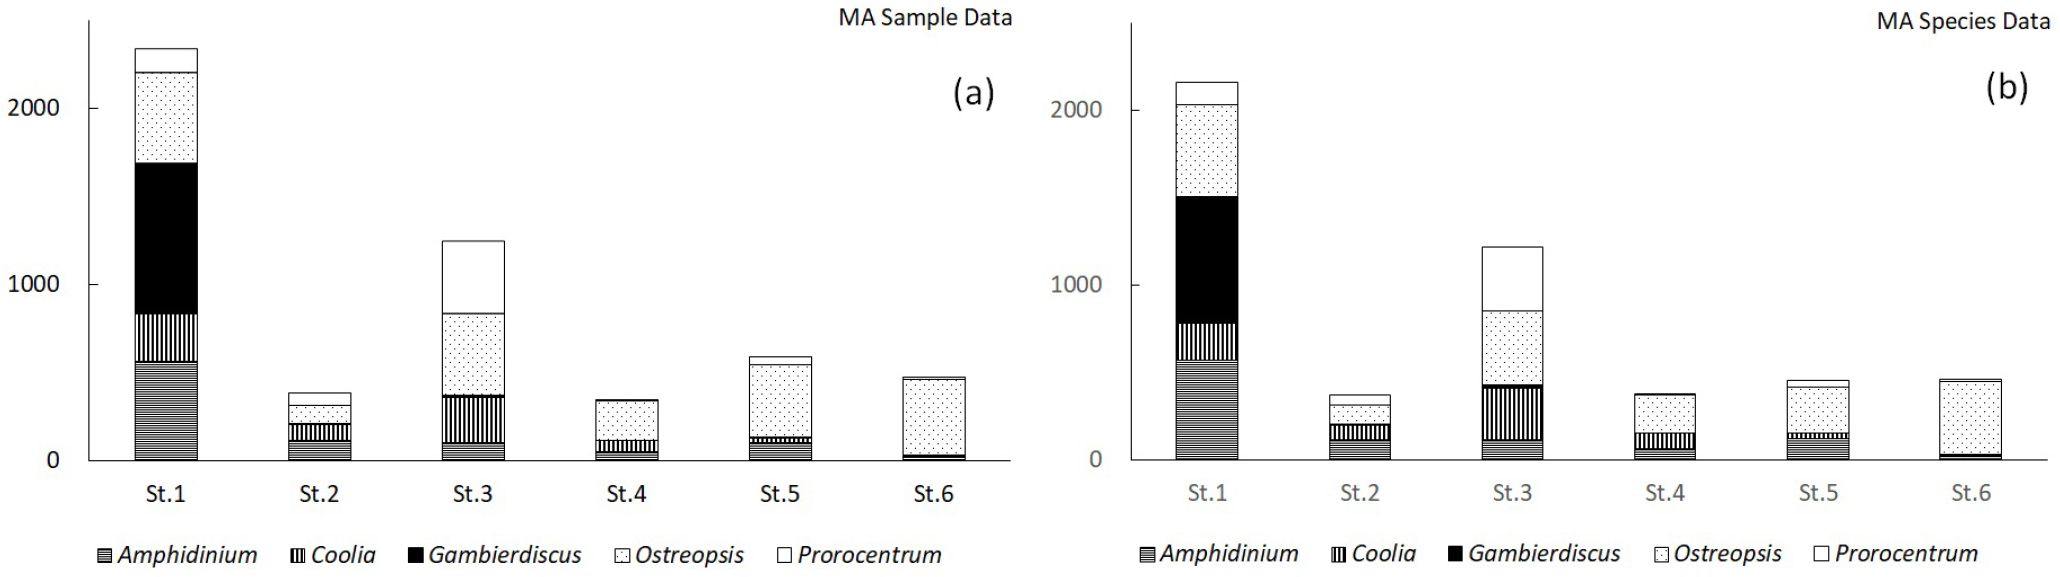
특히, 정점 1에서는 Gambierdiscus의 평균생물량이 다른 정점의 50배 이상(MA Sample Data 기반) 및 45배 이상(MA Species Data 기반)이었던 반면, 정점 4에서만 유독 “0”을 기록하여(Fig. 13(a), 13(b) and Fig. 14), 정점 1과 정점 4간의 극단적인 대조를 다시 나타내었다. MA Sample Data 및 MA Species Data 기반의 정점간 평균생물량 최고치 대비 최저치의 비율(최고치/최소치)이 Ostreopsis (4.8-5.0)에서는 Gambierdiscus를 제외한 3개 속(20.0-62.1)에 비하여 1/4 이하로 낮게 나타나(Fig. 14의 우측 열 그래프), Ostreopsis가 정점에 따른 환경변화에 대한 영향을 가장 덜 받는 것으로 보였다. 계절적인 평균생물량 변동에서도(Fig. 14의 좌측 열 그래프) 6월과 8월에는 Gambierdiscus가 10 (cells gww-1) 이하로, 다른 계절의 Gambierdiscus 평균생물량 평균(184.5-217.0 cells gww-1)의 1/21.2-1/52.6로 낮게 나타나, Ostreopsis에 비해 정점 및 계절에 따라 극심한 시공간적 변화를 기록하였다(Figs. 12 and 13).
3.4 MA Sample Data와 MA Species Data의 비교
MA 시료별(MA Sample Data) 및 MA 종별(MA Species Data) EPD 속별 대표 생물량 자료 전체를 나타낸 두 종류의 그래프(Figs. 2 and 3)는 서로 구분하기 어려울 정도로 유사하게 보였다. 두 종류의 전체 자료로부터 81개 MA 종을 대표하는 81개씩의 EPD 속별 평균 생물량을 나타낸 그래프(Figs. 5 and 6)에서는 두 종류 간의 미세한 차이를 시각적으로 확인할 수 있었다. 또한, 두 가지 대표 생물량 기반자료로부터 시공간적인 36개 시료 채집점 별로 시료의 MA 생물종을 통합한 EPD 속별 평균생물량 계산값 36개씩을 나타낸 두 종류의 그래프(Figs. 8 and 9)에서는 생물량의 차이를 보다 쉽게 확인할 수 있었다. 따라서, 각종 자료분석을 위한 기반자료로서 MA Sample Data와 MA Species Data 가운데 어느 것을 적용하느냐에 따라, 분석결과 해석에 부분적인 영향을 줄 수 있음을 확인하였다.
520개 MA 시료에서 산출된 2600개 MA Sample Data 및 1955개 MA Species Data의 각 EPD 속별 총평균 생물량(기준 1에 의한 조사해역을 대표하는 총평균) 그래프에서 MA Sample Data 기반인 경우와 MA Species Data 기반인 경우에 산출된 총평균값이 서로 다르게 나타났다(Fig. 4; Tables 1 and 2). 마찬가지로, 시료의 81개 MA 종을 대표하는 EPD 속별 평균 생물량의 속별 총평균(기준 2에 의한 조사해역을 대표하는 총평균(Fig. 7; Tables 3 and 4) 및 36개 시료 채집점을 대표하는 EPD 속별 평균 생물량 분포와 총평균 값(기준 3에 의한 조사해역을 대표하는 총평균; Fig. 10; Tables 5 and 6)에서도 MA Sample Data 및 MA Species Data 기반인 경우 간의 차이가 확인되었다. 이로써, 총평균 생물량 계산을 위한 세 가지 기준 모두에서, 최종 결과 값인 EPD 속별 총평균 생물량이 MA Sample Data 기반인 경우와 MA Species Data 기반인 경우 사이에 식별할 만한 차이가 있음을 확인하였다.
Table 5.
Statistics based on MA Sample Data including maximum and grand average of MA species-pooled genus-specific means of EPD abundance for 36 MA samples groups representing 36 spatiotemporal sampling points around the Jeju coast
Table 6.
Statistics based on MA Species Data including maximum and grand mean of MA species-pooled genus-specific means of EPD abundance for 36 MA samples groups representing 36 spatiotemporal sampling points around the Jeju coast
MA Sample Data 및 MA Species Data를 기반으로 한 두 쌍의 자료처리 값들 사이의 상관성을 비교 분석하기 위하여, 520개 씩의 각 시료 대표값(Figs. 2 and 3), 81개 MA 종 각각의 전체 시료 대표 평균값(Figs. 5 and 6) 및 36개 시료 채집점 별 평균값(Figs. 8 and 9) 등에 대하여, EPD 속별로 두 쌍의 해당 자료 간의 관계를 보여주는 산점도를 분석하였다(Fig. 15). MA Sample Data 및 MA Species Data를 기반으로 한 두 쌍의 자료처리 값들 사이의 산점도 분석 결과, 전반적으로 기반 원자료인 MA Sample Data와 MA Species Data 사이의 상관도(상관계수 및 결정계수 기반)가 81개 MA 종 평균 자료나 36개 시료 채집점 별 평균값의 경우 등에 비해 520개 씩의 각 시료 대표값에서 모든 EPD 속에 걸쳐 가장 낮게 나타났으며, 81개 MA 종 평균 자료에서 대부분 가장 높게 나타났다(Fig. 15의 제 1열, 2열 및 3열 사이의 비교). 비교 대상인 자료 세 종류인 시료 대표값(Fig. 15의 제 1열) 및 2 종류의 평균값(Fig. 15의 제 2열 과 제 3열) 각각에서 MA Sample Data와 MA Species Data 사이의 상관도를 EPD 속 별로 살펴보면, Gambierdiscus에서 가장 낮았고, Amphidinium에서 가장 높게 나타났다(Fig. 15의 3개 열에 속하는 각각의 5개 EPD 속들 간의 상호비교). 이로써, 각종 자료분석을 위한 기반자료로서 MA Sample Data와 MA Species Data 가운데 어느 자료를 적용하느냐에 따라, EPD 속별의 생물량에 대한 분석 결과의 차이가 EPD 속에 따라 차등적으로 나타날 수 있음을 확인하였다. 즉, 상관도가 높게 나온 Amphidinium이나 Ostreopsis에 비해, 낮게 나온 나머지 Gambierdiscus, Prorocentrum, Coolia 등이 경우에는 기반자료로서 MA Sample Data와 MA Species Data 가운데 어느 것을 적용할 것인지 특별히 유의할 필요가 있다고 판단하였다. 이론적으로, MA Species Data는 시공간 샘플링 지점을 대표하는 기반 데이터로서 MA Sample Data보다 더 적절할 것이지만, 원자료의 고유성이 가려질 수 있다는 측면을 고려할 필요가 있다.
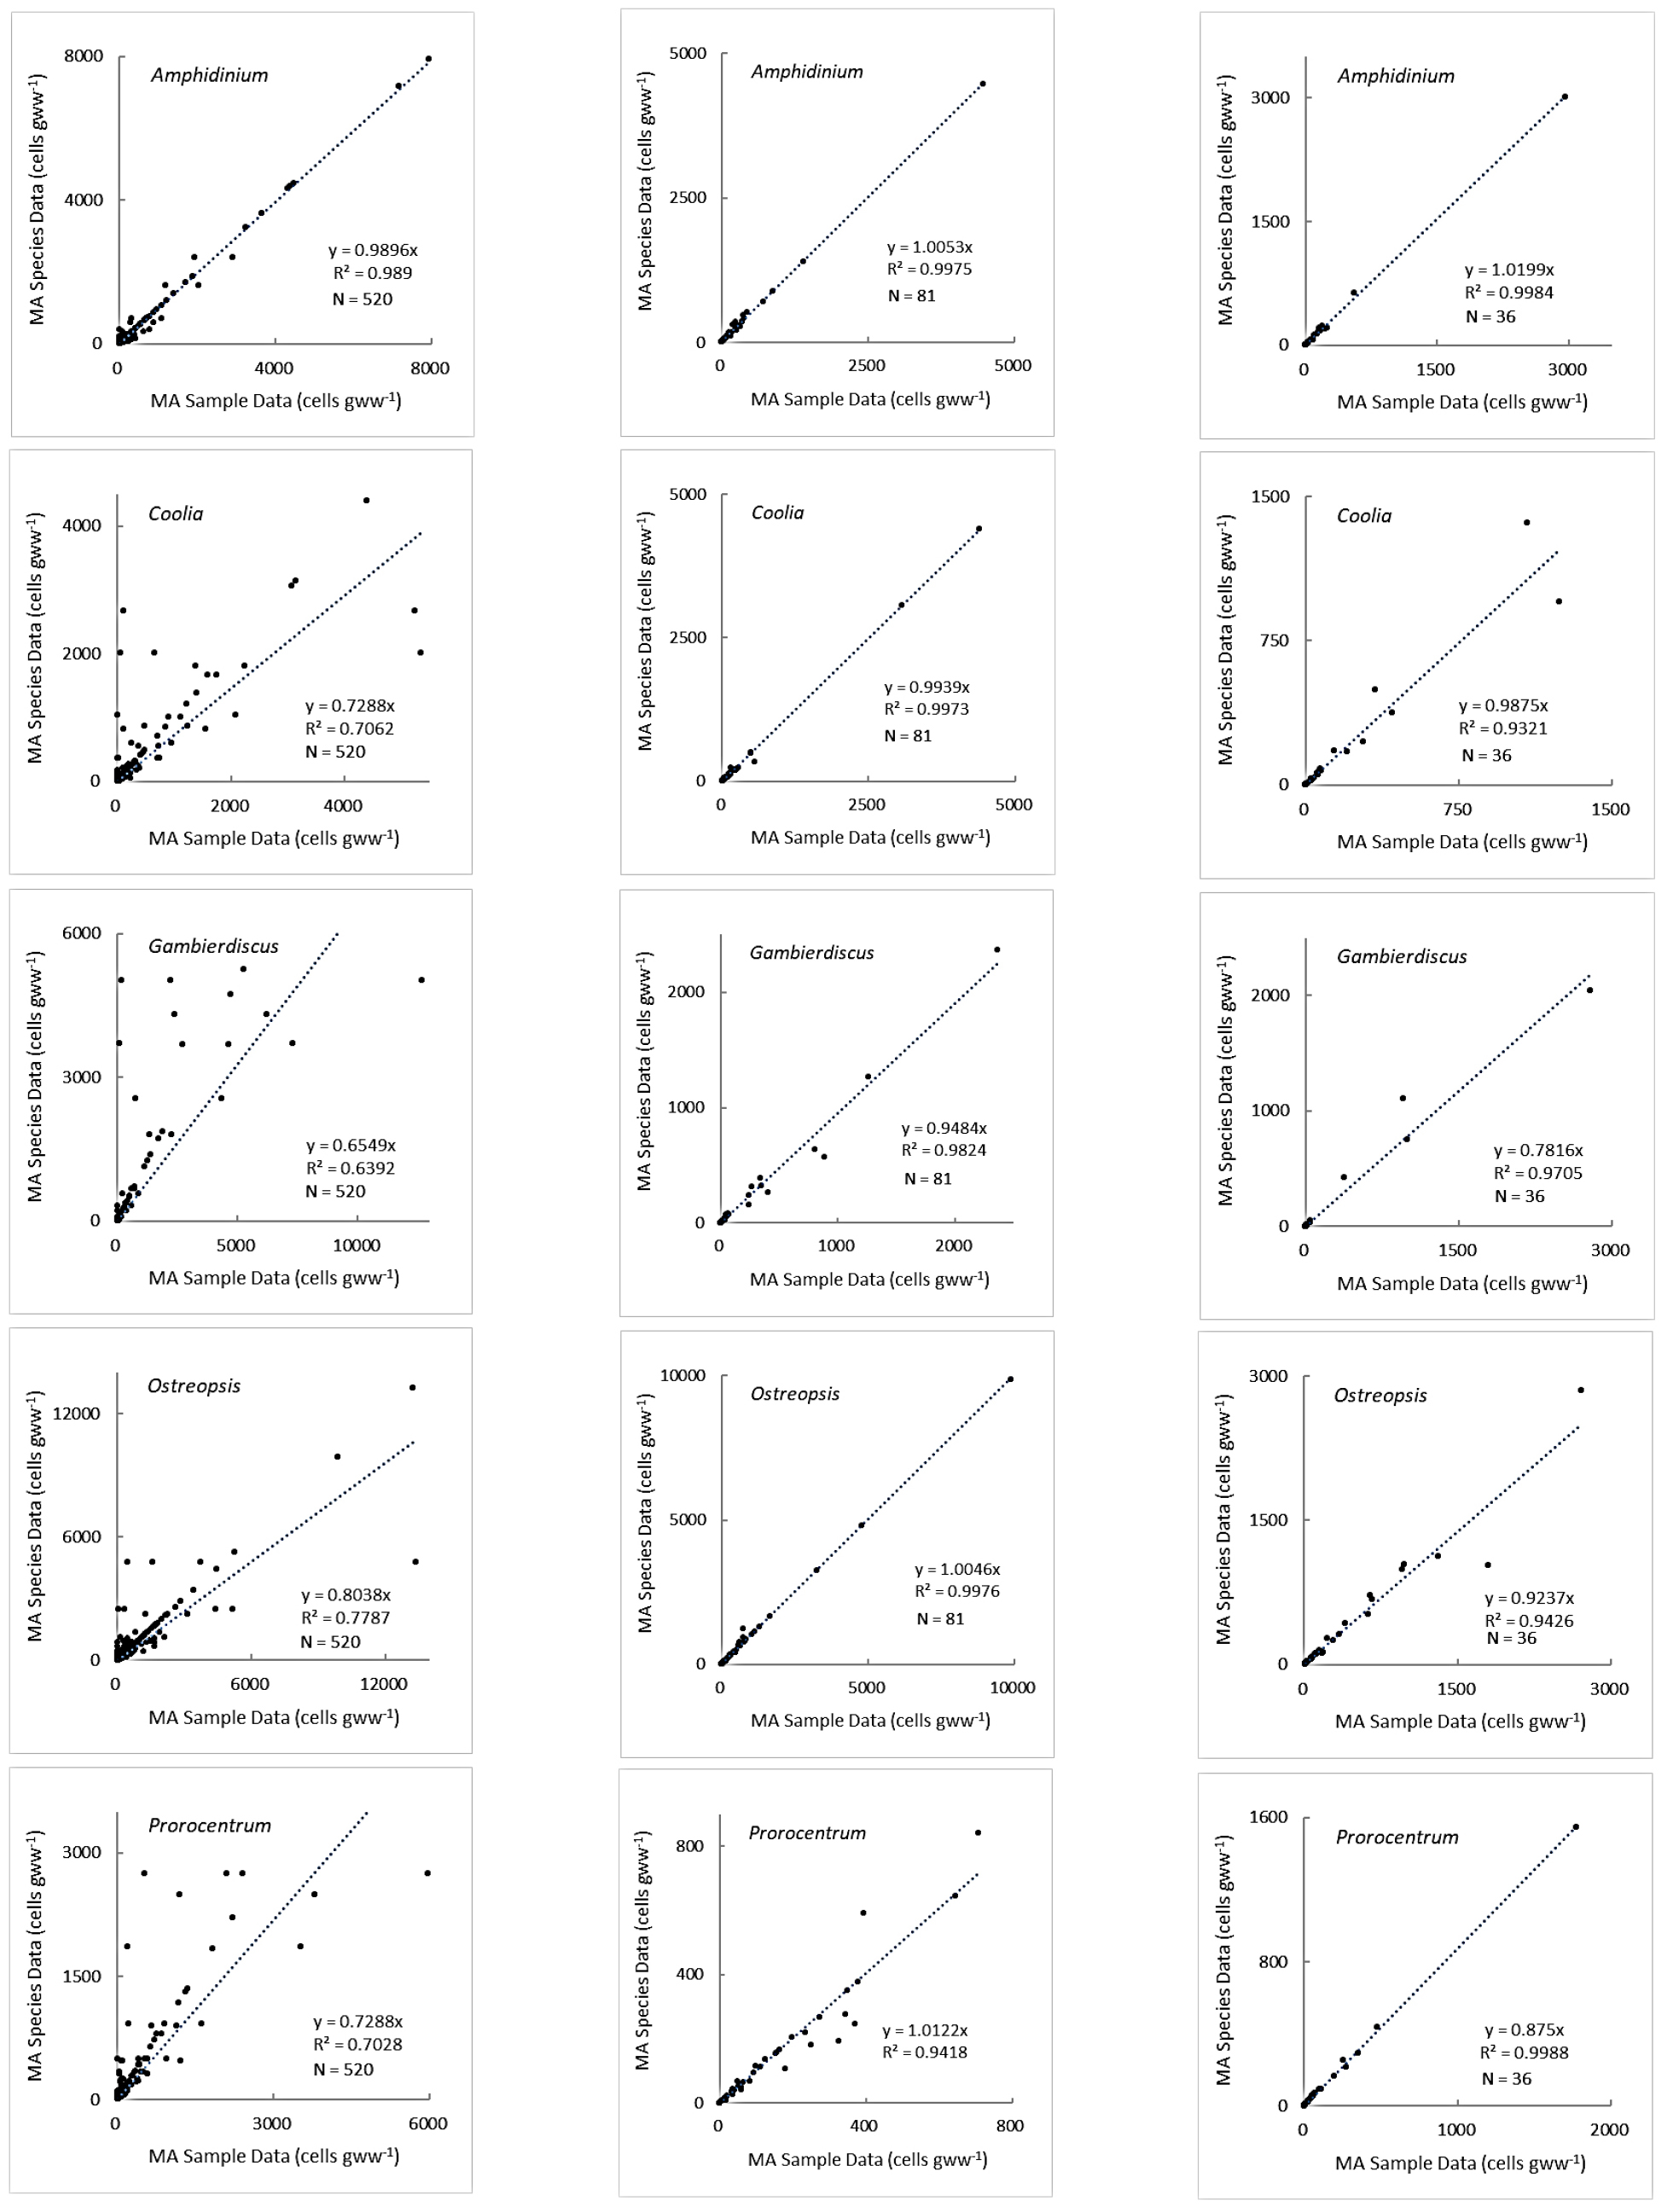
Fig. 15.
Scatter diagrams showing relationship between both the axes (MA Sample Data and MA Species Data) with genus-specific EPD abundances (cells gww-1) for 520 MA samples (left column), 81 MA species-specific means (middle column), and 36 spatiotemporal sampling point-specific means (right column).
3.5 온대 해역에서 나타난 높은 Gambierdiscus 생물량
전체 MA 시료에서 확인된 EPD 속별 생물량 가운데, 최대값은 Ostreopsis (13666 cells gww-1)에서 가장 높고, Gambierdiscus, Amphidinium, Prorocentrum 및 Coolia (각각 12686, 7922, 5956 및 5342 cells gww-1) 순으로 낮아졌다(Table 1 and Fig. 1). 이로써, 본 연구에서 확인된 Gambierdiscus 생물량의 최대값은 12686 cells gww-1 (10월 정점 1의 홍조류인 참곱슬이 시료 2 (Plocamium telfairiae-2; Fig. 1)로, 한국 해역에서 확인된 최고 생물량이다(Kim et al., 2011; 2021). 다음의 7316 (10월 정점 1의 부챗말 시료 1 (Padina arborescens-1)), 6219 (10월 정점 1의 주름뼈대그물말 시료 2 (Dictyopteris undulata-2)), 5254 (10월 정점 1의 산호말류 시료 (Corallina sp.1)) 순으로 전체 520개 MA 시료 가운데 4개에서 5000 cells gww-1 이상의 높은 Gambierdiscus 값이 나타났다. 추가적으로, 13개 시료에서 1000 cells gww-1 이상의 높은 값이 나타났는데(4734 (4월 정점 1), 4647 (2월 정점 1), 4335 (10월 정점 1), 2722 (2월 정점 1), 2388 (10월 정점 1), 2248 (2월 정점 1), 2206 (10월 정점 1), 1871 (12월 정점 1), 1725 (12월 정점 1), 1385 (10월 정점 1), 1335 (2월 정점 1), 1268 (12월 정점 1) 및 1126 cells gww-1 (12월 정점 1) 등), 모두 정점 1(성산)의 MA 시료에서 확인된 값이다. 다음으로 18개 MA 시료에서 200~1000 cells gww-1의 Gambierdiscus 생물량이 나타났는데, 정점 3의 2개 시료(262, 10월; 400 cells gww-1, 8월)를 제외한 16개 시료 역시 정점 1(성산)에서 채집되었다.
1000 cells gww-1 이상의 높은 Gambierdiscus 생물량을 나타낸 17개 MA 시료 전체와 200~1000 cells gww-1을 보인 추가적인 18개 MA 시료 중 16개가 정점 1 (성산)에서 채집된 점은 주목할 만하다. 결과적으로 전체 520개 MA 시료 가운데, 33개(6.3%)에서 200 cells gww-1 이상의 높은 Gambierdiscus 생물량이 나타났으며, 이 33개의 시료 중 31개(93.9%)가 정점 1에 집중되어 있어서(Fig. 14), 정점 1이 다른 정점들과는 Gambierdiscus 생물량 분포에서 매우 차별적임을 시사한다(Figs. 13(a) and 13(b)). 또한, Gambierdiscus의 520개 전체 시료의 평균 생물량이 841 cells gww-1을 보인 정점 1과는 달리 최저의 평균 생물량을 나타낸 정점 4 (0.4 cells gww-1) 및 나머지 4개 정점(1.1-17 cells gww-1)들과 확연한 대조를 나타내었다.
결과적으로 본 연구에서 제시된‘온대 해역에서 나타난 높은 Gambierdiscus 생물량’은 제주해역 전반에서 진행되고 있는 변화 현상이 아니라, 극히 제한된 일부 수역(성산의 연안의 소만 내측 정점인 정점 1)에서 주로 10월에 나타난 특이한 결과라 할 수 있다(Table 7). Gambierdiscus spp.생물량 분포에서 이와 같은 매우 독특한 공간적 편협성과 시간적 산발성에 대하여, 최근 다른 연구에서도 보고된 바 있다. 한 예로, 중국, 한국, 일본 해역을 포함한 전세계 해역(Chinain et al., 2020)에서 1000 cells gww-1 미만의 자료가 85%인 반면에 10,000 cells gww-1 이상은 5%에 불과하였으며 (Chinain et al., 2020), 플로리다 해역에서는 Gambierdiscus spp.의 출현이 매우 산발적이어서 최고 생물량은 16,800 cells gww-1에 달하였으나 전체 EPD 총생물량의 평균 5% 수준의 값을 보였다(Accoroni et al., 2020). 본 연구에서는 전체 시료 가운데 1000 cells gww-1 미만이 96.7%였고 10,000 cells gww-1 이상은 1건으로 0.19% 수준이고, 1000 cells gww-1 이상의 값은 모두 정점 1에서만 출현하였다(Table 7). 이 가운데 10,000 cells gww-1 이상 값과 1000 cells gww-1 이상의 17건은 정점 1의 10월 시료에서 집중적으로 나타났으므로(Table 7의 끝 열), 제주해역의 다른 정점 및 계절에서는 Gambierdiscus 생물량이 아직도 매우 낮은 수준임을 알 수 있다.
Table 7.
Statistics based on MA Sample Data including maximum and average values of Gambierdiscus abundance (cells gww-1) for 520 MA samples collected from six stations around Jeju coast
정점 4와 가장 극단적인 시료 당 Gambierdiscus 생물량의 차이를 나타낸 정점 1 (성산)은 제주도 동쪽 해안의 중간 위도에 위치하여(N33°27′38.28″/E126°56′03.64″; Oh et al., 2023) 제주 난류의 물리적인 영향이 거의 없으며, 성산리 남측 연안의 소만 내측에 있어(성산리 성산일출해양공원승선장 인근 수역) 모든 정점 가운데 수층의 교란이 가장 작아, EPD가 MA의 표면에서 서식하기에 적합한 환경이다. 이와는 대조적으로, 제주 난류(Jeju Warm Current, JWC)의 흐름으로 인한 와도(소용돌이도)의 보존을 위한 상층의 용승과 조석혼합에 따른 위치에너지(potential energy) 생성이 가져온 저층의 수직적 혼합상태(Kim and Lee, 1982; Pang and Kim, 1993)가 동시에 유지되는 특징을 가진 제주도의 서쪽 끝 해안에 위치한 정점 4 (신도)에서는 수직혼합 및 수층의 교란 강도가 높으므로, EPD의 부착, 서식, 성장 등의 측면에서 가장 불리한 환경이다. 이런 차이 때문에 6개 조사 시기를 평균한 정점별 누적 막대그래프(Figs. 13(a) and 13(b))에서는 정점 1이 6개 정점 가운데 뚜렷한 최고치를 보인 반면, 정점 4에서는 최소값을 보여, 동서 쪽 양 끝의 정점 1과 정점 4 간의 극단적인 대조를 나타낸 것으로 설명할 수 있다.
Gambierdiscus 속은 생물량 뿐만 아니라, 520개 MA 시료 중의 출현 비율도 19.5%로 낮아, 다른 4개의 EPD 속의 출현비율(35.6-67.5%)에 비해 상대적으로 더욱 드물게 츨현하였다 (Table 1). 결국, 대부분의 Gambierdiscus 생물량은 정점 1에 집중되어 있을 뿐만 아니라(Figs. 13 and 14) 극히 일부의 MA 시료에서만 고밀도로 확인되어(Tables 1 and 2), 정량적 정성적으로 모두 매우 불균일한 분포의 특징을 나타내었다. 이와 같은 Gambierdiscus 생물량의 소구역 집중현상은 호주의 뉴사우스웨일즈 남부의 온대 연안역 정점들 가운데 유독 Merimbula 및 Wagonga 포구(남위 37도)에서만 6565-8255 cells gww-1의 매우 높은 Gambierdiscus 생물량이 남반구 온대역에서 처음 보고된 사례(Kohli et al., 2014)와 유사한 것으로 판단된다. 제주해역 EPDs에 대한 기존 연구에서도 4871 cells gww-1의 Gambierdiscus 생물량 최대값이 보고된 바 있어(Kim et al., 2011), 이는 북반구 온대역에서 처음 보고된 높은 Gambierdiscus 생물량으로 판단된다. 가을철 1회의 6개 정점에 대한 직전 연구(Kim et al., 2011)에 이어, 년 중 격월간으로 6개 정점에서 채집한 520개 MA 시료를 대상으로 한 본 연구에서는 5342-12686 cells gww-1의 높은 Gambierdiscus 생물량이 정점 1에서 채집한 4개의 MA 시료에서 확인되었다.
제주 해역 가운데 매우 제한된 소구역(정점 1)에서 나타난 높은 Gambierdiscus 생물량은 구성종의 어독 생성 여부에 따라, 큰 관심의 대상이 될 수 있다. 와편모류에 대한 체계적인 분류학적 연구 결과(Li et al., 2021) 제주 해역에서 출현한 Gambierdiscus 속 strain에서는 Gambierdiscus caribaeus (Jeong et al., 2012) 및 Gambierdiscus jejuensis (Jang et al., 2018) 등의 두 종이 보고되었다. 그러나, Gambierdiscus caribaeus 분류에 사용된 strain GCJJ1 (Jeong et al., 2012)은 type 2로 분리되었고(Nakada et al., 2018), GCJJ1를 포함한 type 2의 strain들을 함께 묶어 신종 Gambierdiscus jejuensis으로 개명하자는 제안이 있었다(Jang et al., 2018; Tester et al., 2020). Gambierdiscus jejuensis와 Gambierdiscus sp. type 2는 Artemia 독성 시험(Lim and Jeong, 2021) 및 쥐 생물검정(Nishimura et al., 2013)에서 독성이 전혀 확인되지 않은 것으로 보고되었다.
온대역에서는 다양한 Gambierdiscus 속의 다양한 종들 가운데, Gambierdiscus jejuensis와 Gambierdiscus sp. type 2 등의 무독성 종들이 우점하는 반면, 아열대역에서는 독성종들이 우점하므로(Nishimura et al., 2013), 온대역에서 이들 무독성 종들이 높은 비율로 출현할 것으로 예측되었다(Nishimura et al., 2018). 동해 일본 연안의 Wakasa 만에서 262 cells gww-1의 최고 생물량을 나타낸 Gambierdiscus spp. strain들은 모두 Gambierdiscus jejuensis와 LSU rDNA D8-D10의 염기서열이 일치하였으며(Nakada et al., 2018), 이들은 10°C 이하에서는 생존하여 월동할 수 없을 것으로 예상되었다(Yoshimatsu et al., 2014). 월동 수온과 관련하여, 6565-8255 cells gww-1의 매우 높은 Gambierdiscus 생물량이 보고된 호주의 뉴사우스웨일즈 남부의 온대 연안역의 연중 수온 변화폭은 8-28°C로서(Kohli et al., 2014) 생존(잔존)하여 월동할 수 있는 하한(Nakada et al., 2018)이 10°C 이하인 경우로 해석된다. 온대해역에서 점차 고위도로 확장되어 나타나는 Gambierdiscus 종류들 가운데, 북위 40.06°N에 있는 Balearic Islands 정점에서(Tudó et al., 2020) 남위 35.23°S (Tester et al., 2020)의 범위에서 출현하는 G. australes는 대표적인 광역 분포종으로 알려져 있다. 결론적으로, 제주 해역에서 출현한 높은 생물량의 Gambierdiscus spp.는 거의 대부분 무독성인 Gambierdiscus jejuensis 또는 Gambierdiscus sp. type 2에 속하는 종류로서, 해양 환경의 장기적인 변화에 따른 서식 해역의 확장으로, 제주 해역 가운데 환경 교란으로부터 연중 가장 보호된 소해역인 정점 1 (성산리 남측 연안의 소만 내측)에서 월동이 가능하게 된 종류일 것으로 판단된다.
3.6 EPD 생물량의 시공간적 분포 특성을 감안한 시료 채집 방법
EPD 세포가 부착하는 기저 생물인 MA는 해수 중의 3차원 공간에서 서식하는 해양생물종의 하나이므로, 자체가 3차원 구조로 된 MA 표면에 착생하는 EPDs는 이중 3D (3D-3D) 환경에서 서식하는 생물종으로(Tester et al., 2022, Villareal and Morton, 2002), 시공간적인 미세 서식환경의 차이에 따라 매우 불균일한 분포 특성을 나타낼 수 있다(Yong et al., 2018; Lee et al., 2020).
이러한 불균일한 분포는 본 연구 결과 가운데, Gambierdiscus에서 가장 두드러지게 나타났다(Figs. 13 and 14). 36개 시료 채집점(6개 정점*6개 시점) 각각에서 MA 종을 통틀어 계산한 EPD 속별 평균 생물량 자료 36개씩을 기반으로 작성한 6개 조사시기 평균의 정점별 누적 막대그래프(Figs. 13(a) and 13(b))에서 정점 1이 뚜렷한 최고치를 보였을 뿐만 아니라, Gambierdiscus의 평균 생물량이 다른 정점의 50배 이상(MA Sample Data 기반; 855 cells gww-1) 및 45배 이상(MA Species Data 기반; 725 cells gww-1)이었다. 즉, 두 기반의 Gambierdiscus 평균 생물량이 정점 3에서는 각각 17 및 16 cells gww-1이었고, 나머지 4개 정점에서는 0-7 cells gww-1 범위를 기록하여 극심한 정점 간의 차이를 나타내었다(Figs. 13, Fig. 14의 정점별 Gambierdiscus 분포).
이와 같은 미세 서식환경에 대한 EPDs 분포의 예민성을 감안할 때, 시료 채집 방법의 표준화를 통해서라도 분석자료의 추가적인 변동성을 최소화할 필요가 있다. 국내의 Gambierdiscus 및 Ostreopsis의 생물량 분포에 대한 기존의 연구 결과를 보면, 시기 및 장소에 따라 생물량 분포의 극심한 차이를 확인할 수 있다(Table 8). Ostreopsis의 경우, 시기 및 장소와 관계없이 조하대에서 수중 시료의 잠수채집 여부에 따라, 보고된 생물량의 대부분이 좌우되었다. 조간대 시료를 제외하면, 보고된 Ostreopsis 생물량의 최대값과 최소값의 비율은 61.8배(8660/140)로 Gambierdiscus의 해당 비율인 204.6배(2046/10)에 비해 적은 변동폭을 나타내었다(Table 8). 즉, 저조 시간에 잠수채집 대상이 아닌 정도로 작은 수심의 조하대에 접근하여 MA 시료를 채집한 경우와 상대적으로 더 깊은 수심의 조하대에서 잠수채집한 경우, 후자에서 더 높은 EPDs 생물량이 산출되었다는 결론이다. 특히, Gambierdiscus는 Ostreopsis에 비해 잠수채집 여부에 따른 생물량 차이가 상대적으로 더 심한 것으로 나타나, 서로 비교 가능하도록 어느 해역을 대표하는 EPDs 생물량을 산출하기 위해서는, MA 시료 채집방법이 표준화된 연구를 반복하여 수행할 필요가 있다.
Table 8.
Abundances of the epiphytic Gambierdiscus and Ostreopsis species (cells gww-1) in Korean seas. Reported EPD abundances were obtained from independent studies and various sampling methods, making direct inter-comparison between studies be very difficult
| Gambierdiscus | Ostreopsis | Sampling method | Dates and Location | Reference |
| 1599 (max) | 8660 (max) | Diving |
31 Oct.–1 Nov. 2009. Jeju coasts | Kim et al.(2011) |
|
20 (max, Baekdo), 56 (max, Seopsom) | - | Diving |
28-29 Apr. 2011. Baekdo, Seopsom | Baek(2012a) |
| 10 (max, Pohang) | 140 (max, Pohang) |
Subtidal sampling at low tide |
25-30 Nov. 2011. 27 coastal stations | Baek(2012b) |
| 7.4 (annual mean, Hamduk) | 338 (mean, Oct.) |
Monthly intertidal sampling |
Jun 2012-Jun 2013, Jeju coasts | Shah et al.(2013) |
| - | 1588 (mean, July, Samjeong) |
Subtidal sampling at low tide |
Aug. 2016-Dec. 2017, Pohang coasts | Lee and Park(2020) |
| - | 158 (max, Namwon) |
Subtidal sampling at low tide |
5 Apr.2017. Jeju coasts | Kim and Seo(2019) |
| - |
3204 (max, Jeju). 389 (total mean) | Diving |
Seasonal, 2016-2018. Jeju coasts | Park et al.(2020) |
| 254 (mean, Seongsan) | 295 (mean, Namwon) | Diving |
31 Oct.–1 Nov. 2009. Jeju coasts | Kim et al.(2021) |
|
841 (total mean, Oct. Seongsan) |
494 (total mean, Oct. Seongsan) | Diving |
Bimonthly 2012, Jeju coasts | Oh et al.(2023) |
